Infrared Is Beautiful
Infrared is Beautiful
Why was James Webb Space Telescope designed to observe infrared light? How can its images hope to compare to those taken by the (primarily) visible-light Hubble Space Telescope? The short answer is that Webb will absolutely capture beautiful images of the universe, even if it won’t see exactly what Hubble sees. (Spoiler: It will see a lot of things even better.)

The James Webb Space Telescope, or Webb, is our upcoming infrared space observatory, which will launch in 2019. It will spy the first luminous objects that formed in the universe and shed light on how galaxies evolve, how stars and planetary systems are born, and how life could form on other planets.
What is infrared light?
This may surprise you, but your remote control uses light waves just beyond the visible spectrum of light—infrared light waves—to change channels on your TV.
Infrared light shows us how hot things are. It can also show us how cold things are. But it all has to do with heat. Since the primary source of infrared radiation is heat or thermal radiation, any object that has a temperature radiates in the infrared. Even objects that we think of as being very cold, such as an ice cube, emit infrared.
There are legitimate scientific reasons for Webb to be an infrared telescope. There are things we want to know more about, and we need an infrared telescope to learn about them. Things like: stars and planets being born inside clouds of dust and gas; the very first stars and galaxies, which are so far away the light they emit has been stretched into the infrared; and the chemical fingerprints of elements and molecules in the atmospheres of exoplanets, some of which are only seen in the infrared.
In a star-forming region of space called the ‘Pillars of Creation,’ this is what we see with visible light:

And this is what we see with infrared light:

Infrared light can pierce through obscuring dust and gas and unveil a more unfamiliar view.
Webb will see some visible light: red and orange. But the truth is that even though Webb sees mostly infrared light, it will still take beautiful images. The beauty and quality of an astronomical image depends on two things: the sharpness of the image and the number of pixels in the camera. On both of these counts, Webb is very similar to, and in many ways better than, Hubble. Webb will take much sharper images than Hubble at infrared wavelengths, and Hubble has comparable resolution at the visible wavelengths that Webb can see.

Webb’s infrared data can be translated by computer into something our eyes can appreciate – in fact, this is what we do with Hubble data. The gorgeous images we see from Hubble don’t pop out of the telescope looking fully formed. To maximize the resolution of the images, Hubble takes multiple exposures through different color filters on its cameras.
The separate exposures, which look black and white, are assembled into a true color picture via image processing. Full color is important to image analysis of celestial objects. It can be used to highlight the glow of various elements in a nebula, or different stellar populations in a galaxy. It can also highlight interesting features of the object that might be overlooked in a black and white exposure, and so the images not only look beautiful but also contain a lot of useful scientific information about the structure, temperatures, and chemical makeup of a celestial object.
This image shows the sequences in the production of a Hubble image of nebula Messier 17:

Here’s another compelling argument for having telescopes that view the universe outside the spectrum of visible light – not everything in the universe emits visible light. There are many phenomena which can only be seen at certain wavelengths of light, for example, in the X-ray part of the spectrum, or in the ultraviolet. When we combine images taken at different wavelengths of light, we can get a better understanding of an object, because each wavelength can show us a different feature or facet of it.
Just like infrared data can be made into something meaningful to human eyes, so can each of the other wavelengths of light, even X-rays and gamma-rays.
Below is an image of the M82 galaxy created using X-ray data from the Chandra X-ray Observatory, infrared data from the Spitzer Space Telescope, and visible light data from Hubble. Also note how aesthetically pleasing the image is despite it not being just optical light:

Though Hubble sees primarily visible light, it can see some infrared. And despite not being optimized for it, and being much less powerful than Webb, it still produced this stunning image of the Horsehead Nebula.

It’s a big universe out there – more than our eyes can see. But with all the telescopes now at our disposal (as well as the new ones that will be coming online in the future), we are slowly building a more accurate picture. And it’s definitely a beautiful one. Just take a look…
…At this Spitzer infrared image of a shock wave in dust around the star Zeta Ophiuchi.

…this Spitzer image of the Helix Nebula, created using infrared data from the telescope and ultraviolet data from the Galaxy Evolution Explorer.

…this image of the “wing” of the Small Magellanic Cloud, created with infrared data from Spitzer and X-ray data from Chandra.

…the below image of the Milky Way’s galactic center, taken with our flying SOFIA telescope. It flies at more than 40,000 feet, putting it above 99% of the water vapor in Earth’s atmosphere– critical for observing infrared because water vapor blocks infrared light from reaching the ground. This infrared view reveals the ring of gas and dust around a supermassive black hole that can’t be seen with visible light.

…and this Hubble image of the Mystic Mountains in the Carina Nebula.

Learn more about the James Webb Space Telescope HERE, or follow the mission on Facebook, Twitter and Instagram.
Image Credits Eagle Nebula: NASA, ESA/Hubble and the Hubble Heritage Team Hubble Image Processing - Messier 17: NASA/STScI Galaxy M82 Composite Image: NASA, CXC, JHU, D.Strickland, JPL-Caltech, C. Engelbracht (University of Arizona), ESA, and The Hubble Heritage Team (STScI/AURA) Horsehead Nebula: NASA, ESA, and The Hubble Heritage Team (STScI/AURA) Zeta Ophiuchi: NASA/JPL-Caltech Helix Nebula: NASA/JPL-Caltech Wing of the Small Magellanic Cloud X-ray: NASA/CXC/Univ.Potsdam/L.Oskinova et al; Optical: NASA/STScI; Infrared: NASA/JPL-Caltech Milky Way Circumnuclear Ring: NASA/DLR/USRA/DSI/FORCAST Team/ Lau et al. 2013 Mystic Mountains in the Carina Nebula: NASA/ESA/M. Livio & Hubble 20th Anniversary Team (STScI)
Make sure to follow us on Tumblr for your regular dose of space: http://nasa.tumblr.com.
More Posts from Carlosalberthreis and Others

Essa sequência de mapas mostra a variação na temperatura da superfície da lua Titã de Saturno, num intervalo de dois anos, de 2004 a 2006. As medidas foram feitas com o instrumento Composite Infrared Spectrometer (CIRS) da sonda Cassini da NASA.
Os mapas mostram a radiação térmica infravermelha, o calor, vindo da superfície de Titã, no comprimento de onda de 19 mícron, uma janela espectral onde a atmosfera opaca da lua é na sua maior parte transparente. As temperaturas têm sido calculadas como a média para todo o globo de leste para oeste, para enfatizar as varrições sazonais na latitude. Regiões em preto nos mapas são áreas onde não se obteve dados.
As temperaturas na superfície de Titã mudam vagarosamente no decorrer das longas estações, que duram cerca de sete anos e meio. Como na Terra, a quantidade de luz do Sol recebida em qualquer latitude varia à medida que a iluminação do Sol se move para o norte ou para o sul no decorrer do ano de Saturno que dura 30 anos.
Quando a Cassini chegou em Saturno em 2004, o hemisfério sul de Titã estava no meio do verão e então era a região mais quente. Pouco depois do equinócio de 2009, em 2010, as temperaturas eram simétricas nos hemisférios norte e sul, reproduzindo o que a sonda Voyager 1 em 1980 (1 ano de Titã antes). As temperaturas na sequência esfriaram no sul e subiram no norte, à medida que o inverno no sul se aproximava.
Enquanto que a tendência geral de variação de temperatura é claramente evidente nesses mapas, existe uma faixa estreita em alguns lugares que é um artefato das observações feitas através da atmosfera de Titã. O denso envelope de névoa adiciona um ruído e torna as medidas difíceis.
A animação mostrada abaixo mostra um modelo simplificado da variação da temperatura durante os anos. As faixas de latitude têm sido suavizadas para mostrar mais claramente como a temperatura de pico de Titã se move de 19 graus sul para 16 graus norte entre 2004 e 2016. O pequeno globo na parte superior direita mostra uma visão de Titã como visto da direção do Sol. A latitude em Titã quando o Sol está a pino, é indicado pela estrela amarela.
Embora se mova em latitude, a medida máxima de temperatura em Titã permanece ao redor de -179.6 graus Celsius, com uma temperatura mínima no polo somente 6 graus mais baixa. Esse é um contraste muito menor do que o existente, por exemplo, na Terra onde as temperaturas variam de mais de 100 graus Celsius entre a mais fria e a mais quente.
Esses mapas de temperatura da superfície de Titã são visualizações das medidas que foram publicadas na revista Astrophysical Journal Letters.
Fonte:
http://astronomynow.com/2016/02/23/taking-titans-temperature-2004-2016/
2GP�R�"zV'8
Juno Spacecraft: What Do We Hope to Learn?

The Juno spacecraft has been traveling toward its destination since its launch in 2011, and is set to insert Jupiter’s orbit on July 4. Jupiter is by far the largest planet in the solar system. Humans have been studying it for hundreds of years, yet still many basic questions about the gas world remain.

The primary goal of the Juno spacecraft is to reveal the story of the formation and evolution of the planet Jupiter. Understanding the origin and evolution of Jupiter can provide the knowledge needed to help us understand the origin of our solar system and planetary systems around other stars.

Have We Visited Jupiter Before? Yes! In 1995, our Galileo mission (artist illustration above) made the voyage to Jupiter. One of its jobs was to drop a probe into Jupiter’s atmosphere. The data showed us that the composition was different than scientists thought, indicating that our theories of planetary formation were wrong.
What’s Different About This Visit? The Juno spacecraft will, for the first time, see below Jupiter’s dense clover of clouds. [Bonus Fact: This is why the mission was named after the Roman goddess, who was Jupiter’s wife, and who could also see through the clouds.]

Unlocking Jupiter’s Secrets
Specifically, Juno will…
Determine how much water is in Jupiter’s atmosphere, which helps determine which planet formation theory is correct (or if new theories are needed)
Look deep into Jupiter’s atmosphere to measure composition, temperature, cloud motions and other properties
Map Jupiter’s magnetic and gravity fields, revealing the planet’s deep structure
Explore and study Jupiter’s magnetosphere near the planet’s poles, especially the auroras – Jupiter’s northern and southern lights – providing new insights about how the planet’s enormous
Juno will let us take a giant step forward in our understanding of how giant planets form and the role these titans played in putting together the rest of the solar system.
For updates on the Juno mission, follow the spacecraft on Facebook, Twitter, YouTube and Tumblr.
Make sure to follow us on Tumblr for your regular dose of space: http://nasa.tumblr.com
Eu já falei muitas vezes para vocês que os buracos negros podem ser classificados em 3 categorias: os buracos negros supermassivos encontrados no centro de galáxias, os buracos negros de massa estelar e os buracos negros intermediários.
Esses últimos ainda não tiveram sua existência confirmada, mas os astrônomos acreditam que eles devem sim existir.
Esse tipo de buraco negro teria uma massa entre 100 e 10 mil vezes a massa do Sol e a importância além de serem o ele perdido entre os buracos negros estelares e os supermassivos, eles poderiam ser as sementes que dão origem aos buracos negros supermassivos.
Um grupo de astrônomos anunciou na última edição da revista Nature evidências para a existência de um buraco negro de massa intermediária no interior do aglomerado globular 47 Tucanae.
Esse aglomerado tem 12 bilhões de anos de vida e está localizado a cerca de 13 mil anos-luz de distância da Terra, na constelação de Tucano.
Ele contém milhares de estrelas, condensadas numa bola com 120 anos-luz de diâmetro. Além disso ele possui duas dezenas de pulsares que são importantes para essas evidências.
Esse aglomerado já foi examinado na busca por buraco negro, mas o resultado não foi o desejado, porque não no raio-X só é possível identificar os buracos negros supermassivos se alimentando ferozmente. O que não é o caso no interior desse aglomerado.
Mesmo em buracos negros mais calmos como o da nossa galáxia, inferir a sua presença não é algo complicado pois as estrela na sua volta começam a se movimentar a altas velocidades, algo também que não foi identificado no 47 Tucanae.
No caso de um aglomerado globular, uma evidência para a presença de um buraco negro é o movimento geral das estrelas, o buraco negro funciona como uma colher, recolhendo estrelas e atirando-as a altas velocidades e a grande distâncias, isso gera um sinal que é detectado pelos astrônomos.
Outra evidência são os pulsares, que emitem sinais de rádio facilmente detectados, com a presença do buraco negro de massa intermediária os pulsares são detectados a distâncias maiores do centro do que se o buraco negro não existisse.
combinando essas evidências e usando modelos computacionais, os astrônomos concluíram a presença de um buraco negro com massa equivalente a 2200 vezes a massa do Sol no 47 Tucanae.
Essa descoberta é importante, pois a técnica de detecção e a metodologia usada no processamento dos dados podem ser aplicadas a outras aglomerados globulares na busca por mais buracos negros de massa intermediária, e assim vamos também traçando a linha evolutiva desses que são um dos objetos mais intrigantes do universo.
(via https://www.youtube.com/watch?v=0WCJy3bBKfY)

Enquanto a Lua passava em frente do Sol durante o eclipse total do dia 21 de Agosto de 2017, um fotógrafo da NASA capturou uma foto que pode ser considerada mais rara do que o próprio eclipse.
Joel Kowsky, um dos editores de fotografia da agência, foi até Banner no Wyoming, para ver o eclipse total do Sol, quando ele fotografou a Estação Espacial Internacional passando na frente do Sol crescente.
Abaixo você pode ver um vídeo que foi feito usando uma câmera de alta velocidade que registrou 1500 frames por segundo. Ele também fotografou a ISS com uma câmera padrão.
Essa alta velocidade é necessária pois a ISS tem o tamanho de um campo de futebol, orbita a Terra a cerca de 300 km de altura e se move a uma velocidade 17500 milhas por hora.
Para fazer esse belo registro é necessário um pouco de sorte e meses e meses de planejamento.
ffff%v;��X
From the unique vantage point of about 25,000 feet above Earth, our Associate Administrator of Science at NASA, Dr. Thomas Zurbuchen, witnessed the 2017 eclipse. He posted this video to his social media accounts saying, “At the speed of darkness…watch as #SolarEclipse2017 shadow moves across our beautiful planet at <1 mile/second; as seen from GIII aircraft”.
Zurbuchen, along with NASA Acting Administrator Robert Lightfoot, Associate Administrator Lesa Roe traveled on a specially modified Gulfstream III aircraft flying north over the skies of Oregon.
In order to capture images of the event, the standard windows of the Gulfstream III were replaced with optical glass providing a clear view of the eclipse. This special glass limits glare and distortion of common acrylic aircraft windows. Heaters are aimed at the windows where the imagery equipment will be used to prevent icing that could obscure a clear view of the eclipse.
Learn more about the observations of the eclipse made from this aircraft HERE.
Make sure to follow us on Tumblr for your regular dose of space: http://nasa.tumblr.com
#Eclipse2017
Solar System: Things to Know the August Eclipse
We’re counting down until the August 21 total solar eclipse that will be visible across most of North America. Here are some things you can do to prepare.

1. Find A Spot
The eclipse should be visible to some extent across the continental U.S. Here’s map of its path.
Our eclipse page can help you find the best viewing locations by longitude and latitude: eclipse.gsfc.nasa.gov/SEgoogle/SEgoogle2001/SE2017Aug21Tgoogle.html
2. Citizen Science
Want to know more about citizen science projects? Find a list of citizen science projects for the eclipse: https://eclipse.aas.org/resources/citizen-science

3. Never look directly at the sun! Even during the early phases of the eclipse!
Get your eclipse viewing safety glasses beforehand: eclipse2017.nasa.gov/safety

4. Get Our Interactive Eclipse Module App
In this interactive, 3D simulation of the total eclipse on August 21, 2017, you can see a view of the eclipse from anywhere on the planet:
http://eyes.jpl.nasa.gov/eyes-on-eclipse.html
5. Got questions?
Join the conversation on social media. Tag your posts: #Eclipse2017.
Twitter: @NASASolarSystem, @NASA, @NASASunEarth Facebook: NASA Solar System
Discover the full list of 10 things to know about our solar system this week HERE.
Follow us on Tumblr for your regular dose of space: http://nasa.tumblr.com
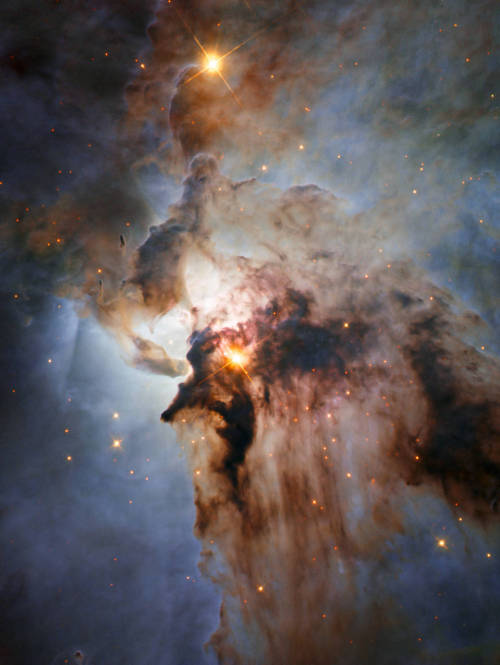
This new NASA/ESA Hubble Space Telescope image shows the center of the Lagoon Nebula, an object with a deceptively tranquil name, in the constellation of Sagittarius. The region is filled with intense winds from hot stars, churning funnels of gas, and energetic star formation, all embedded within an intricate haze of gas and pitch-dark dust.
Image Credit: NASA/JPL/ESA/J. Trauger

Lua e Terra fotografadas pela Apollo 17 em Dezembro de 1972.
6 Ways NASA Space Communications Connect Astronauts to Earth
1. When Astronauts Phone Home, the Space Network Answers

Operated by our Goddard Space Flight Center in Greenbelt, Maryland, this communications system enables all types of Earth-to-astronaut communication. The Space Network is a complex system of ground station terminals and satellites. The satellites, called ‘Tracking and Data Relay Satellites’ or TDRS, provide continuous communications for human spaceflight 24/7/365. The information this network relays includes astronaut communication with Mission Control in Houston, posting live video of spacewalks and live interviews with schools, even posting Tweets on Twitter and doing Facebook posts. The Space Network can even broadcast live 4K, ultra-HD video right from the station. You can now watch an astronaut eat a space taco in high definition. WHAT A TIME TO BE ALIVE!
2. The Space Network Also Communicates Science Data

Astronauts on the Space Station perform experiments on the station that will enable our Journey to Mars and other future human space missions. For example, astronaut Peggy Whitson works on a bone cell study that could lead to better preventative care or therapeutic treatments for people suffering bone loss as a result of bone diseases like osteopenia and osteoporosis, or for patients on prolonged bed rest. All that fantastic data is sent back to Earth via our Space Network for scientists around the world to analyze and build on.
3. The Space Network Transmits Spacecraft Health Data

The Space Network not only lets us communicate with the astronauts, it also tracks the ‘health’ of the spacecraft, be it the International Space Station where the astronauts are living, a cargo vehicle servicing the space station, or even, in the near future, crewed vehicles to other worlds. We deliver data on a spacecraft’s state of health, from power generation levels and avionics status to carbon dioxide and oxygen levels, and more to Mission Control 24/7/365.
4. The Space Network Helps Monitor Spacecraft Location

The International Space Station Is pretty big, but space is bigger. The Space Network enables flight controllers on the ground to provide a GPS-type service for the Space Station, letting them track the exact location of the space station at all times as it orbits the Earth. It also allows us Earth-bound folk to get real-time text updates when the Space Station is flying overhead. If you want to track the station, sign up here: https://spotthestation.nasa.gov
5. The Space Network Supports Launch Vehicles

Goddard’s Space Network also controls all the communications for all the missions that go to the space station. That includes command and telemetry services during launches, free flight, berthing and un-berthing to the station, as well as re-entry and landing back to Earth.
6. The Space Network Is Also Looking Toward the Future

It’s also helping to test vehicles that will carry astronauts to other worlds. Currently, they are working with teams for our Space Launch System and commercial crew vehicles. The first flights for these vehicles will occur in 2018 and 2019, setting us on the road to Journey to Mars! This image shows the Orion capsule that will aid in our continuous march into space.
What’s Next for the Space Network?
We’re continuing to grow! Watch out for the launch of a new TDRS spacecraft in August 2017! TDRS-M is coming. Check out more info here and join our countdown to TDRS launch: https://tdrs.gsfc.nasa.gov.
Por mais de duas décadas, desde a descoberta do primeiros exoplaneta, os astrônomos já descobriram mais de 3200 desses objetos pelo universo.
Exoplanetas de todos os tipos já foram descobertos, super-terras, júpiteres-quentes, parecidos com Netuno, orbitando, 2, 3 e até 4 estrelas, sistemas com 1, 2 e até 6 planetas. Mas nesse tempo todo, o Proxima b, que estava aqui do nosso lado, nunca tinha sido descoberto, por que?
Não foi por falta de tentar, desde o ano 2000 eles procuram por algum planeta por ali, mas sempre a resposta foi negativa.
Já tentaram encontrar o Proxima b por meio do trânsito e nada, tentaram aplicar a mesma técnica de agora e nada novamente.
Até que em 2013 anunciaram essa descoberta, do exoplaneta mais próximo da Terra. Porém, semanas depois tiveram que voltar e retirar a descoberta, pois não tinham elementos para concluir de forma definitiva que era um exoplaneta.
Por que essa dificuldade?
A estrela Proxima Centauri, é uma estrela do tipo anã vermelha, uma estrela pequena, mas muito ativa, ela tem muitas erupções, gera muito vento estelar e tudo isso acaba criando um ruído nas medições feitas através da técnica do efeito doppler ou da velocidade radial, que confundem os astrônomos.
Era preciso mapear esses fenômenos intrínsecos da estrela, para que eles fossem retirados dos dados e então o exoplaneta poderia aparecer.
Para isso os astrônomos montaram uma campanha inteiramente dedicada a observação da Proxima Centauri, com muitos telescópios, durante um período de 60 dias, além de buscarem dados antigos da estrela.
Com isso, conseguiram confirmar a presença do Proxima b.
Agora, é esperar novas observações, novos dados, novas pesquisas sobre esse que até o momento é o exoplaneta mais esperado da história da astronomia.
(via https://www.youtube.com/watch?v=nT6y8cwTURs)
-
 ethepearl liked this · 7 months ago
 -
 alissonafreitas liked this · 11 months ago
 -
 exerciseinexposure reblogged this · 1 year ago
 -
 cleverwitchwerewolf reblogged this · 1 year ago
 -
cleverwitchwerewolf liked this · 1 year ago
-
 censosrpg liked this · 1 year ago
 -
 bilexualclarke liked this · 2 years ago
 -
 oncominggstorm reblogged this · 2 years ago
 -
 clawedandcute liked this · 2 years ago
 -
 chromanebula reblogged this · 2 years ago
 -
 saspas-corner liked this · 2 years ago
 -
 randomlettrrsqqssfxwcvhxnqbwriro liked this · 2 years ago
 -
 adii-132327 reblogged this · 2 years ago
 -
adii-132327 liked this · 2 years ago
-
 quasoboy liked this · 2 years ago
 -
 official-mudskipper reblogged this · 2 years ago
 -
 18beeen liked this · 2 years ago
 -
 lyliana1277 liked this · 2 years ago
 -
lyliana1277 reblogged this · 2 years ago
-
 awesomefairytailfamily liked this · 2 years ago
 -
 hope-and-a-dream liked this · 2 years ago
 -
 acid-to-water liked this · 2 years ago
 -
 stupidwithadashofawesome liked this · 2 years ago
 -
 cheddarboye liked this · 2 years ago
 -
 gmo-fruit liked this · 2 years ago
 -
 stuffedanimalbaconstrip liked this · 2 years ago
 -
 wolfofgallifrey reblogged this · 2 years ago
 -
 theinnocentwarrior liked this · 2 years ago
 -
 zweizilla98 reblogged this · 2 years ago
 -
zweizilla98 liked this · 2 years ago
-
 natureisgay liked this · 2 years ago
 -
 aroanehring liked this · 2 years ago
 -
 theoisinthevoid liked this · 2 years ago
 -
 horrgores liked this · 2 years ago
 -
 dandymaximilian liked this · 2 years ago
 -
 rickpines liked this · 2 years ago
 -
 smol-ruby liked this · 2 years ago
 -
 jenahid liked this · 2 years ago
