Jupyterjones - Productivity Please !!!

More Posts from Jupyterjones and Others
![How To Draw A Regular Pentagon [x]](https://64.media.tumblr.com/e789070555deb967c4b2323363be07b9/tumblr_opd8xi3HCJ1vnq1cro1_500.gif)
Regarding Fractals and Non-Integral Dimensionality
Alright, I know it’s past midnight (at least it is where I am), but let’s talk about fractal geometry.
Fractals
If you don’t know what fractals are, they’re essentially just any shape that gets rougher (or has more detail) as you zoom in, rather than getting smoother. Non-fractals include easy geometric shapes like squares, circles, and triangles, while fractals include more complex or natural shapes like the coast of Great Britain, Sierpinski’s Triangle, or a Koch Snowflake.

Fractals, in turn, can be broken down further. Some fractals are the product of an iterative process and repeat smaller versions of themselves throughout them. Others are more natural and just happen to be more jagged.

Fractals and Non-Integral Dimensionality
Now that we’ve gotten the actual explanation of what fractals are out of the way, let’s talk about their most interesting property: non-integral dimensionality. The idea that fractals do not actually have an integral dimension was originally thought up by this guy, Benoit Mandelbrot.

He studied fractals a lot, even finding one of his own: the Mandelbrot Set. The important thing about this guy is that he realized that fractals are interesting when it comes to defining their dimension. Most regular shapes can have their dimension found easily: lines with their finite length but no width or height; squares with their finite length and width but no height; and cubes with their finite length, width, and height. Take note that each dimension has its own measure. The deal with many fractals is that they can’t be measured very easily at all using these terms. Take Sierpinski’s triangle as an example.

Is this shape one- or two-dimensional? Many would say two-dimensional from first glance, but the same shape can be created using a line rather than a triangle.

So now it seems a bit more tricky. Is it one-dimensional since it can be made out of a line, or is it two-dimensional since it can be made out of a triangle? The answer is neither. The problem is that, if we were to treat it like a two-dimensional object, the measure of its dimension (area) would be zero. This is because we’ve technically taken away all of its area by taking out smaller and smaller triangles in every available space. On the other hand, if we were to treat it like a one-dimensional object, the measure of its dimension (length) would be infinity. This is because the line keeps getting longer and longer to stretch around each and every hole, of which there are an infinite number. So now we run into a problem: if it’s neither one- nor two-dimensional, then what is its dimensionality? To find out, we can use non-fractals
Measuring Integral Dimensions and Applying to Fractals
Let’s start with a one-dimensional line. The measure for a one-dimensional object is length. If we were to scale the line down by one-half, what is the fraction of the new length compared to the original length?

The new length of each line is one-half the original length.
Now let’s try the same thing for squares. The measure for a two-dimensional object is area. If we were to scale down a square by one-half (that is to say, if we were to divide the square’s length in half and divide its width in half), what is the fraction of the new area compared to the original area?

The new area of each square is one-quarter the original area.
If we were to try the same with cubes, the volume of each new cube would be one-eighth the original volume of a cube. These fractions provide us with a pattern we can work with.
In one dimension, the new length (one-half) is equal to the scaling factor (one-half) put to the first power (given by it being one-dimensional).
In two dimensions, the new area (one-quarter) is equal to the scaling factor (one-half) put to the second power (given by it being two-dimensional).
In three dimensions, the same pattern follows suit, in which the new volume (one-eighth) is equivalent to the scaling factor (one-half) put to the third power.
We can infer from this trend that the dimension of an object could be (not is) defined as the exponent fixed to the scaling factor of an object that determines the new measure of the object. To put it in mathematical terms:

Examples of this equation would include the one-dimensional line, the two-dimensional square, and the three-dimensional cube:
½ = ½^1
¼ = ½^2
1/8 = ½^3
Now this equation can be used to define the dimensionality of a given fractal. Let’s try Sierpinski’s Triangle again.

Here we can see that the triangle as a whole is made from three smaller versions of itself, each of which is scaled down by half of the original (this is proven by each side of the smaller triangles being half the length of the side of the whole triangle). So now we can just plug in the numbers to our equation and leave the dimension slot blank.
1/3 = ½^D
To solve for D, we need to know what power ½ must be put to in order to get 1/3. To do this, we can use logarithms (quick note: in this case, we can replace ½ with 2 and 1/3 with 3).
log_2(3) = roughly 1.585
So we can conclude that Sierpinski’s triangle is 1.585-dimensional. Now we can repeat this process with many other fractals. For example, this Sierpinski-esque square:

It’s made up of eight smaller versions of itself, each of which is scaled down by one-third. Plugging this into the equation, we get
1/8 = 1/3^D
log_3(8) = roughly 1.893
So we can conclude that this square fractal is 1.893-dimensional.
We can do this on this cubic version of it, too:

This cube is made up of 20 smaller versions of itself, each of which is scaled down by 1/3.
1/20 = 1/3^D
log_3(20) = roughly 2.727
So we can conclude that this fractal is 2.727-dimensional.
gotta catch em all
The Kakeya Problem
Some time ago I (briefly) mentioned that, along with two other students, I was taking a reading course this semester with Dmitriy Bilyk. It hasn’t quite gone in the direction we were initially expecting, but one of our long detours has been an extended sequence of readings around the the Kakeya conjecture. As far as I know, the Kakeya problem (different from the Kakeya conjecture; more on that later) was the first question that fell respectably under the purview of geometric measure theory. So if nothing else, it is interesting from a historical perspective as a question that kickstarted a whole new field of mathematics.
Okay, but what is the Kakeya problem?
As originally posed, it goes like this: given a disk with diameter 1, it is possible to place down a line segment of length 1 into the set, and rotate it (continuously) an entire 180 degrees. But this is not the smallest-area set for which this kind of rotation is possible:

(all pictures in the post are from the Wikipedia page, which is really good)
This set has area $\tau/16$, half that of the circle. So the question naturally becomes: what is the area of the smallest set that allows this kind of rotation?
The answer is known, and it is…
…
zero, basically.
It’s remarkable, but it’s true: you can construct arbitrarily small sets in which you can perform a 180-degree rotation of a line segment! One way to do it goes like this: in the picture above, we reduced the area of the circle by squeezing it until it developed three points. If we keep squeezing to get more points, then the solid “middle” becomes very small, and the tendrils get very thin, so the area keeps decreasing. However, we can still take a line segment and slowly, methodically, shift it back and forth between the set’s pointy bits, parallel-parking style, to eventually get the entire 180 degrees of rotation.
——
You can’t actually get a set with zero area to work. But the reason for that seemed more like a technicality than something actually substantial. So people changed the problem slightly to get rid of those concerns. Now, instead of trying to get a set where you can rotate a line segment through all 180 degrees, you just have to have a set where you can find a line segment in every direction. The difference being that you don’t need to guarantee any smooth way to “move between” these line segments.
Sets that work for the modified problem are often called Kakeya sets (although some people reserve that for the rotation problem and use Besicovitch sets for the modified one). And indeed, there are Kakeya sets which actually have zero area.
The details involved with going from “arbitrarily small” to “actually zero” are considerable, and we won’t get into them here. The following is a simplification (due to Perron) of Besicovitch’s original construction for the “arbitrarily small” case. We take a triangle which clearly has ½ of the directions the needle might possibly take, and split it up into several pieces in such a way that no directions are lost. Then we start to overlap those pieces to get a set (that still has segments in all the same directions) with much smaller area:

We can do this type of construction twice (one triangle “downward-facing” and the other “left-facing”) and then put those two sets together, guarantee that we get all of 180 degrees of directions.
This Besicovitch-Perron construction, itself, only produces sets which are “arbitrarily small”, but was later refined to go all the way to zero. Again, the technicalities involved in closing that gap are (much) more than I want to talk about now. But the fact that these technicalities can be carried out with the Besicovitch-Perron construction is what makes it “better” than the usual constructions for the original Kakeya problem.
——
I should conclude with a few words about the Kakeya conjecture, since I promised them earlier :)
Despite the essentially-solved status of these two classical Kakeya problems, there is at least one big question still left open. It is rather more technical than the original ones, and so doesn’t get a lot of same attention, but I’d like to take a stab at explaining what’s still current research in this sphere of ideas.
Despite the fact that Kakeya sets can be made to be “small” in the sense of measure, we still intuitively want to believe these sets are “big”. There are many ways we can formalize largeness of sets (in $\Bbb R^n$, in particular) but the one that seems to be most interesting for Kakeya things is the notion of Hausdorff dimension. I won’t define the term here, but if you’ve ever heard someone spouting off about fractals, you’ve probably heard the phrase “Fractals have non-integer dimension!”. This is the notion of dimension they’re talking about.
It is known that Kakeya sets in the plane have Hausdorff dimension 2, and that in general a Kakeya set in $n>2$ dimensions has Hausdorff dimension at least $\frac{n}{2}+1$. The proofs of these statements are… difficult, and the general case remains elusive.
One thing more: you can also formulate the Kakeya conjecture in finite fields: in this setting having “dimension $n$” in a vector space over the field $\Bbb F_q$ means that you have a constant times $q^n$ number of points in your set. Wolff proposed this “technicality-free” version in 1999 as a way to study the conjecture for $\Bbb R$. And indeed, a lot of the best ideas for the problem in $\Bbb R$ have come from doing some harmonic analysis on the ideas originally generated for the finite field case.
But then in 2008 Zeev Dvir went and solved the finite field case completely. Which on one hand is great! But on the other hand, Dvir’s method definitely can’t be finessed to work in $\Bbb R$ so we still have work to do :P
——
Partially I wanted to write about this because it’s cool in its own right, but I must admit that my main motivation is a little more pragmatic. There was a talk at SEICCGTC 2017 which showed a surprising connection between the Kakeya problem and a certain combinatorial game. So if you think these ideas are at all interesting, you may enjoy reading the next two posts in this sequence about that talk.
[ Post 1 ] [ Next ]

What’s encrypting your internet surfing? An algorithm created by a supercomputer? Well, if the site you’re visiting is encrypted by the cyber security firm Cloudflare, your activity may be protected by a wall of lava lamps.

Cloudflare covers websites for Uber, OKCupid, & FitBit, for instance. The wall of lamps in the San Francisco headquarters generates a random code. Over 100 lamps, in a variety of colors, and their patterns deter hackers from accessing data.

As the lava lamps bubble and swirl, a video camera on the ceiling monitors their unpredictable changes and connects the footage to a computer, which converts the randomness into a virtually unhackable code.

Codes created by machines have relatively predictable patterns, so it’s possible for hackers to guess their algorithms, posing a security risk. Lava lamps, add to the equation the sheer randomness of the physical world, making it nearly impossible for hackers to break through.

You might think that this would be kept secret, but it’s not. Simply go in and ask to see the lava lamp display. By allowing people to affect the video footage, human movement, static, and changes in lighting from the windows work together to make the random code even harder to predict.

So, by standing in front of the display, you add an additional variable to the code, making it even harder to hack. Isn’t that interesting?
via atlasobscura.com
Eclipse Across America
August 21, 2017, the United States experienced a solar eclipse!

An eclipse occurs when the Moon temporarily blocks the light from the Sun. Within the narrow, 60- to 70-mile-wide band stretching from Oregon to South Carolina called the path of totality, the Moon completely blocked out the Sun’s face; elsewhere in North America, the Moon covered only a part of the star, leaving a crescent-shaped Sun visible in the sky.

During this exciting event, we were collecting your images and reactions online.
Here are a few images of this celestial event…take a look:

This composite image, made from 4 frames, shows the International Space Station, with a crew of six onboard, as it transits the Sun at roughly five miles per second during a partial solar eclipse from, Northern Cascades National Park in Washington. Onboard as part of Expedition 52 are: NASA astronauts Peggy Whitson, Jack Fischer, and Randy Bresnik; Russian cosmonauts Fyodor Yurchikhin and Sergey Ryazanskiy; and ESA (European Space Agency) astronaut Paolo Nespoli.
Credit: NASA/Bill Ingalls

The Bailey’s Beads effect is seen as the moon makes its final move over the sun during the total solar eclipse on Monday, August 21, 2017 above Madras, Oregon.
Credit: NASA/Aubrey Gemignani

This image from one of our Twitter followers shows the eclipse through tree leaves as crescent shaped shadows from Seattle, WA.
Credit: Logan Johnson

“The eclipse in the palm of my hand”. The eclipse is seen here through an indirect method, known as a pinhole projector, by one of our followers on social media from Arlington, TX.
Credit: Mark Schnyder

Through the lens on a pair of solar filter glasses, a social media follower captures the partial eclipse from Norridgewock, ME.
Credit: Mikayla Chase

While most of us watched the eclipse from Earth, six humans had the opportunity to view the event from 250 miles above on the International Space Station. European Space Agency (ESA) astronaut Paolo Nespoli captured this image of the Moon’s shadow crossing America.
Credit: Paolo Nespoli

This composite image shows the progression of a partial solar eclipse over Ross Lake, in Northern Cascades National Park, Washington. The beautiful series of the partially eclipsed sun shows the full spectrum of the event.
Credit: NASA/Bill Ingalls
In this video captured at 1,500 frames per second with a high-speed camera, the International Space Station, with a crew of six onboard, is seen in silhouette as it transits the sun at roughly five miles per second during a partial solar eclipse, Monday, Aug. 21, 2017 near Banner, Wyoming.
Credit: NASA/Joel Kowsky
To see more images from our NASA photographers, visit: https://www.flickr.com/photos/nasahqphoto/albums/72157685363271303
Make sure to follow us on Tumblr for your regular dose of space: http://nasa.tumblr.com
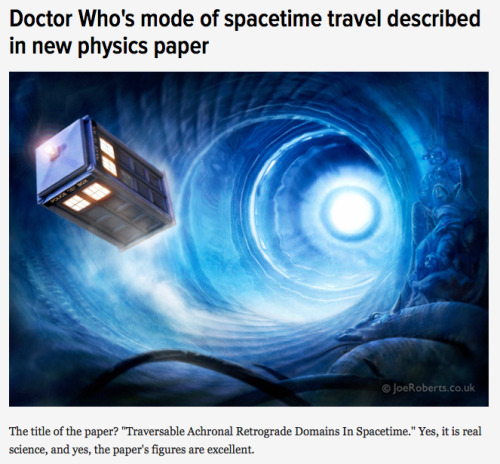
Co-authored by physicists Ben Tippett* and David Tsang (non-fictional physicists at the fictional Gallifrey Polytechnic Institute and Gallifrey Institute of Technology, respectively), the paper – which you can access free of charge over on arXiv – presents a spacetime geometry that would make retrograde time travel possible. Such a spacetime geometry, write the researchers, would emulate “what a layperson would describe as a time machine“ [x]


The 21 Card Trick created in Python.
See how it works and read a little more about it here: [x]
Feel free to ask any questions you may have. :)


Geometry at work: Maxwell, Escher and Einstein
Maxwell’s diagram
from the 1821 “A Philosophical Magazine”, showing the rotative vortexes of electromagnetic forces, represented by hexagons and the inactive spaces between them
The impossible cube
invented in 1958, as an inspiration for his Belvedere litography.
Geometry of space-time
The three dimensions of space and the dimension of time give shape to the fourth, that of space-time.
How Do Hurricanes Form?
Hurricanes are the most violent storms on Earth. People call these storms by other names, such as typhoons or cyclones, depending on where they occur.

The scientific term for ALL of these storms is tropical cyclone. Only tropical cyclones that form over the Atlantic Ocean or eastern and central Pacific Ocean are called “hurricanes.”

Whatever they are called, tropical cyclones all form the same way.
Tropical cyclones are like giant engines that use warm, moist air as fuel. That is why they form only over warm ocean waters near the equator. This warm, moist air rises and condenses to form clouds and storms.

As this warmer, moister air rises, there’s less air left near the Earth’s surface. Essentially, as this warm air rises, this causes an area of lower air pressure below.

This starts the ‘engine’ of the storm. To fill in the low pressure area, air from surrounding areas with higher air pressure pushes in. That “new” air near the Earth’s surface also gets heated by the warm ocean water so it also gets warmer and moister and then it rises.

As the warm air continues to rise, the surrounding air swirls in to take its place. The whole system of clouds and wind spins and grows, fed by the ocean’s heat and water evaporating from the surface.
As the storm system rotates faster and faster, an eye forms in the center. It is vey calm and clear in the eye, with very low air pressure.

Tropical cyclones usually weaken when they hit land, because they are no longer being “fed” by the energy from the warm ocean waters. However, when they move inland, they can drop many inches of rain causing flooding as well as wind damage before they die out completely.
There are five types, or categories, of hurricanes. The scale of categories is called the Saffir-Simpson Hurricane Scale and they are based on wind speed.

How Does NASA Study Hurricanes?
Our satellites gather information from space that are made into pictures. Some satellite instruments measure cloud and ocean temperatures. Others measure the height of clouds and how fast rain is falling. Still others measure the speed and direction of winds.

We also fly airplanes into and above hurricanes. The instruments aboard planes gather details about the storm. Some parts are too dangerous for people to fly into. To study these parts, we use airplanes that operate without people.
Learn more about this and other questions by exploring NASA Space Place and the NASA/NOAA SciJinks that offer explanations of science topics for school kids.
Make sure to follow us on Tumblr for your regular dose of space: http://nasa.tumblr.com.
Credits: NASA Space Place & NASA/NOAA SciJinks
-
 ghost-keeke liked this · 6 months ago
 -
 mellyssecrethideout liked this · 8 months ago
 -
 candyskulllove69 liked this · 8 months ago
 -
 looookingup reblogged this · 10 months ago
 -
 aikiie liked this · 1 year ago
 -
 lollybobolly liked this · 1 year ago
 -
 kawaii-goth-uwu liked this · 1 year ago
 -
 iabotw2 liked this · 1 year ago
 -
 westpertiavertcum liked this · 1 year ago
 -
 anisokassa liked this · 1 year ago
 -
 browanfulru liked this · 1 year ago
 -
 missrupy liked this · 1 year ago
 -
 lexxix3 liked this · 2 years ago
 -
 poketalefan1993 liked this · 2 years ago
 -
 mermaidsfairy liked this · 2 years ago