
Latest Posts by carlosalberthreis - Page 3


The Faint Rings of Uranus
Taken in January, 1986 by Voyager 2. Uranus assembled using orange, simulated green, and violet light. The rings were taken in clear (white) light, but colored red here.
Image Credit: NASA/JPL/Kevin M. Gill
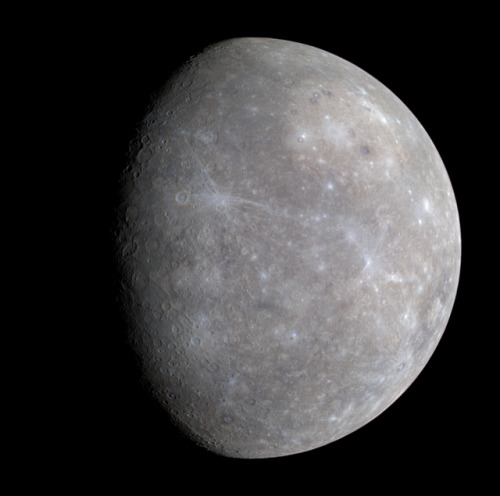
Ten Interesting facts about Mercury
Mercury is the closest planet to the sun. As such, it circles the sun faster than all the other planets, which is why Romans named it after their swift-footed messenger god. He is the god of financial gain, commerce, eloquence, messages, communication (including divination), travelers, boundaries, luck, trickery and thieves; he also serves as the guide of souls to the underworld

Like Venus, Mercury orbits the Sun within Earth’s orbit as an inferior planet, and never exceeds 28° away from the Sun. When viewed from Earth, this proximity to the Sun means the planet can only be seen near the western or eastern horizon during the early evening or early morning. At this time it may appear as a bright star-like object, but is often far more difficult to observe than Venus. The planet telescopically displays the complete range of phases, similar to Venus and the Moon, as it moves in its inner orbit relative to Earth, which reoccurs over the so-called synodic period approximately every 116 days.

Mercury’s axis has the smallest tilt of any of the Solar System’s planets (about 1⁄30 degree). Its orbital eccentricity is the largest of all known planets in the Solar System; at perihelion, Mercury’s distance from the Sun is only about two-thirds (or 66%) of its distance at aphelion.

Its orbital period around the Sun of 87.97 days is the shortest of all the planets in the Solar System. A sidereal day (the period of rotation) lasts about 58.7 Earth days.

Mercury’s surface appears heavily cratered and is similar in appearance to the Moon’s, indicating that it has been geologically inactive for billions of years. Having almost no atmosphere to retain heat, it has surface temperatures that vary diurnally more than on any other planet in the Solar System, ranging from 100 K (−173 °C; −280 °F) at night to 700 K (427 °C; 800 °F) during the day across the equatorial regions. The polar regions are constantly below 180 K (−93 °C; −136 °F). The planet has no known natural satellites.

Unlike many other planets which “self-heal” through natural geological processes, the surface of Mercury is covered in craters. These are caused by numerous encounters with asteroids and comets. Most Mercurian craters are named after famous writers and artists. Any crater larger than 250 kilometres in diameter is referred to as a Basin.

The largest known crater is Caloris Basin, with a diameter of 1,550 km. The impact that created the Caloris Basin was so powerful that it caused lava eruptions and left a concentric ring over 2 km tall surrounding the impact crater.
Two spacecraft have visited Mercury: Mariner 10 flew by in 1974 and 1975; and MESSENGER, launched in 2004, orbited Mercury over 4,000 times in four years before exhausting its fuel and crashing into the planet’s surface on April 30, 2015.

It is the smallest planet in the Solar System, with an equatorial radius of 2,439.7 kilometres (1,516.0 mi). Mercury is also smaller—albeit more massive—than the largestnatural satellites in the Solar System, Ganymede and Titan.

As if Mercury isn’t small enough, it not only shrank in its past but is continuing to shrink today. The tiny planet is made up of a single continental plate over a cooling iron core. As the core cools, it solidifies, reducing the planet’s volume and causing it to shrink. The process crumpled the surface, creating lobe-shaped scarps or cliffs, some hundreds of miles long and soaring up to a mile high, as well as Mercury’s “Great Valley,” which at about 620 miles long, 250 miles wide and 2 miles deep (1,000 by 400 by 3.2 km) is larger than Arizona’s famous Grand Canyon and deeper than the Great Rift Valley in East Africa.

The first telescopic observations of Mercury were made by Galileo in the early 17th century. Although he observed phases when he looked at Venus, his telescope was not powerful enough to see the phases of Mercury.
source 1
source 2
source 3
images: Joseph Brimacombe, NASA/JPL, Wikimedia Commons
A Descoberta de Urano - 13 de Março de 1781
No dia 13 de Março de 1781, William Herschel descobria Urano, o sétimo planeta do Sistema Solar, o primeiro descoberto por um telescópio, veja aí, um resumo da bela história da descoberta desse planeta.
What are Gravitational Waves?
Gravitational waves are ‘ripples’ in the fabric of space-time caused by some of the most violent and energetic processes in the Universe. Albert Einstein predicted the existence of gravitational waves in 1916 in his general theory of relativity.

Einstein’s mathematics showed that massive accelerating objects (such as neutron stars or black holes orbiting each other) would disrupt space-time in such a way that ‘waves’ of distorted space would radiate from the source (like the movement of waves away from a stone thrown into a pond). Furthermore, these ripples would travel at the speed of light through the Universe, carrying with them information about their cataclysmic origins, as well as invaluable clues to the nature of gravity itself.
The strongest gravitational waves are produced by catastrophic events such as colliding black holes,

the collapse of stellar cores (supernovae), coalescing neutron stars or white dwarf stars, the slightly wobbly rotation of neutron stars that are not perfect spheres, and the remnants of gravitational radiation created by the birth of the Universe itself.

hough gravitational waves were predicted to exist in 1916, actual proof of their existence wouldn’t arrive until 1974, 20 years after Einstein’s death. In that year, two astronomers working at the Arecibo Radio Observatory in Puerto Rico discovered a binary pulsar–two extremely dense and heavy stars in orbit around each other. This was exactly the type of system that, according to general relativity, should radiate gravitational waves. Knowing that this discovery could be used to test Einstein’s audacious prediction, astronomers began measuring how the period of the stars’ orbits changed over time. After eight years of observations, it was determined that the stars were getting closer to each other at precisely the rate predicted by general relativity. This system has now been monitored for over 40 years and the observed changes in the orbit agree so well with general relativity, there is no doubt that it is emitting gravitational waves.

Since then, many astronomers have studied the timing of pulsar radio emissions and found similar effects, further confirming the existence of gravitational waves. But these confirmations had always come indirectly or mathematically and not through actual 'physical’ contact.
That was the case up until September 14, 2015, when LIGO, for the first time, physically sensed distortions in spacetime itself caused by passing gravitational waves generated by two colliding black holes nearly 1.3 billion light years away! LIGO and its discovery will go down in history as one of the greatest human scientific achievements.

How are gravitational waves detected?
When a gravitational wave passes by Earth, it squeezes and stretches space. LIGO can detect this squeezing and stretching. Each LIGO observatory has two “arms” that are each more than 2 miles (4 kilometers) long. A passing gravitational wave causes the length of the arms to change slightly. The observatory uses lasers, mirrors, and extremely sensitive instruments to detect these tiny changes. Watch the animation below to see how this works!

Lucky for us here on Earth, while the origins of gravitational waves can be extremely violent, by the time the waves reach the Earth they are millions of times smaller and less disruptive. In fact, by the time gravitational waves from the first detection reached LIGO, the amount of space-time wobbling they generated was thousands of times smaller than the nucleus of an atom! Such inconceivably small measurements are what LIGO was designed to make. To find out how LIGO can achieve this task, visit LIGO’s Interferometer.
Source: LIGO & spaceplace.nasa.gov
Image credit: LIGO/VIRGO (SXS, the Simulating eXtreme Spacetimes) & NASA/Goddard Space Flight Center
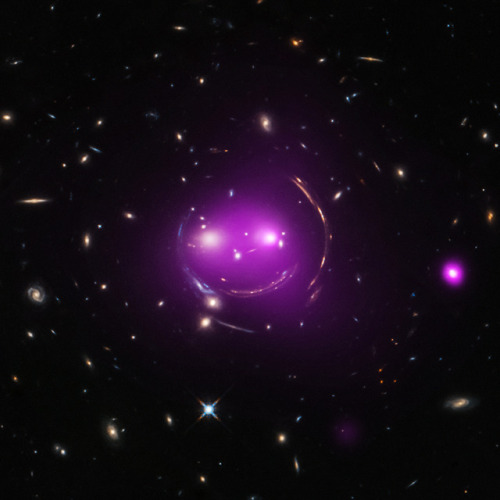
The latest results from the “Cheshire Cat” group of galaxies show how manifestations of Einstein’s 100-year-old theory can lead to new discoveries today. Astronomers have given the group this name because of the smiling cat-like appearance. Some of the feline features are actually distant galaxies whose light has been stretched and bent by the large amounts of mass, most of which is in the form of dark matter detectable only through its gravitational effect, found in the system.
Image credit: NASA / STScI / Chandra & Hubble
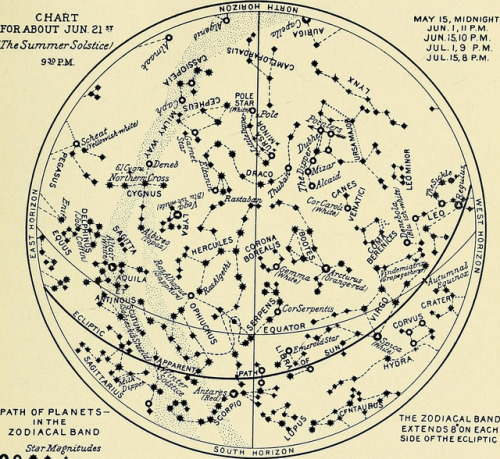
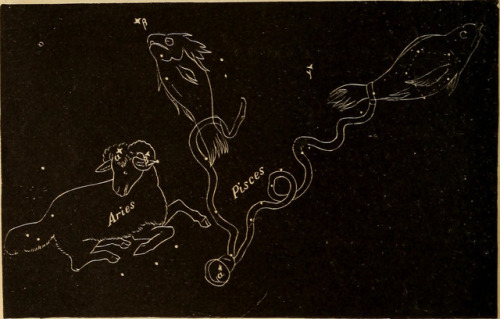
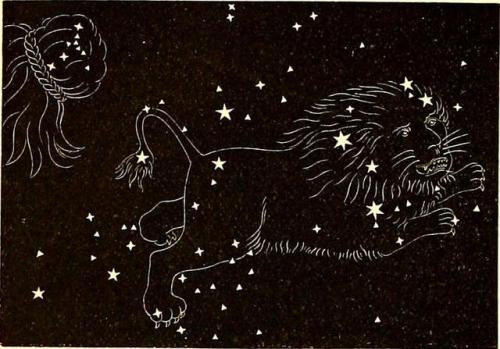
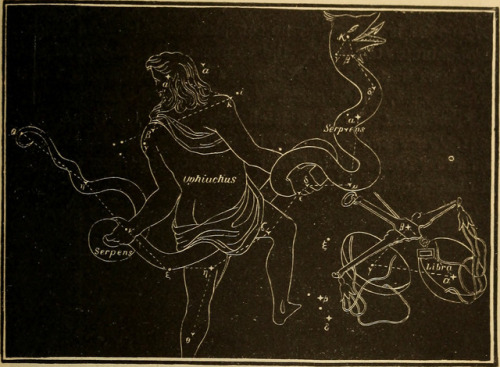
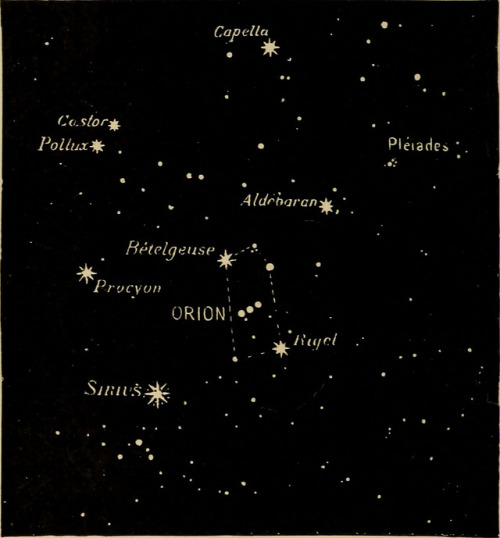
Constellations
A constellation is a group of stars that are considered to form imaginary outlines or meaningful patterns on the celestial sphere, typically representing animals, mythological people or gods, mythological creatures, or manufactured devices. The 88 modern constellations are formally defined regions of the sky together covering the entire celestial sphere.
Origins for the earliest constellations likely goes back to prehistory, whose now unknown creators collectively used them to related important stories of either their beliefs, experiences, creation or mythology. As such, different cultures and countries often adopted their own set of constellations outlines, some that persisted into the early 20th Century. Adoption of numerous constellations have significantly changed throughout the centuries. Many have varied in size or shape, while some became popular then dropped into obscurity. Others were traditionally used only by various cultures or single nations.
The Western-traditional constellations are the forty-eight Greek classical patterns, as stated in both Aratus’s work Phenomena or Ptolemy’s Almagest — though their existence probably predates these constellation names by several centuries. Newer constellations in the far southern sky were added much later during the 15th to mid-18th century, when European explorers began travelling to the southern hemisphere. Twelve important constellations are assigned to the zodiac, where the Sun, Moon, and planets all follow the ecliptic. The origins of the zodiac probably date back into prehistory, whose astrological divisions became prominent around 400BCE within Babylonian or Chaldean astronomy.
In 1928, the International Astronomical Union (IAU) ratified and recognized 88 modern constellations, with contiguous boundaries defined by right ascension and declination. Therefore, any given point in a celestial coordinate system lies in one of the modern constellations. Some astronomical naming systems give the constellation where a given celestial object is found along with a designation in order to convey an approximate idea of its location in the sky. e.g. The Flamsteed designation for bright stars consists of a number and the genitive form of the constellation name.
source
images
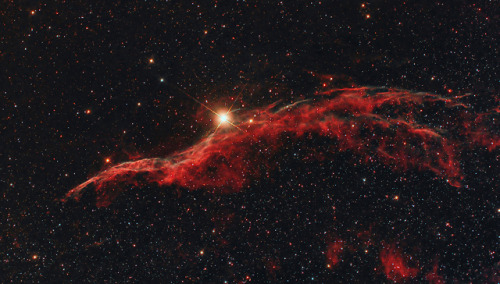
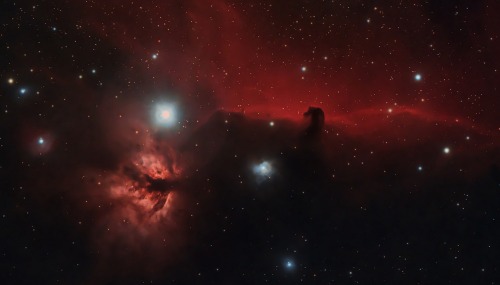
NGC 6960 (Western Veil nebula) & Horsehead Nebula and the Flame Nebula
by David Wills
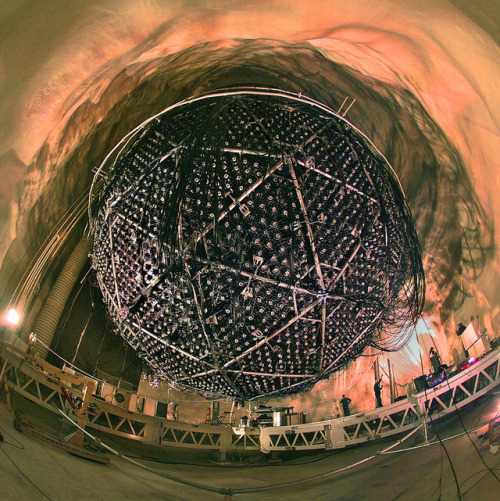
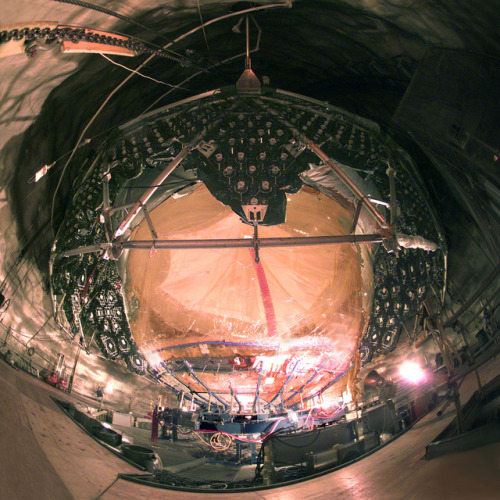

The Sudbury Neutrino Observatory (SNO)
Located in a cave more than a mile underground in Canada, SNO can be thought of as a type of telescope, though it bears little resemblance to the image most people associate with that word. It consists of an 18-meters-in-diameter stainless steel geodesic sphere inside of which is an acrylic vessel filled with 1000 tons of heavy water (deuterium oxide or D2O). Attached to the sphere are 9,522 ultra-sensitive light-sensors called photomultiplier tubes. When neutrinos passing through the heavy water interact with deuterium nuclei, flashes of light, called Cerenkov radiation, are emitted. The photomultiplier tubes detect these light flashes and convert them into electronic signals that scientists can analyze for the presence of all three types of neutrinos.
Berkeley Lab
Stellar parallax
In astronomy, parallax is the difference in the apparent position of an object seen by observers in different places. Stellar parallax is used to measure the distance of stars using the motion of the Earth in its orbit. Created by the different orbital positions of Earth, the extremely small observed shift is largest at time intervals of about six months, when Earth arrives at exactly opposite sides of the Sun in its orbit, giving a baseline distance of about two astronomical units between observations. The parallax itself is considered to be half of this maximum, about equivalent to the observational shift that would occur due to the different positions of Earth and the Sun, a baseline of one astronomical unit (AU).

Stellar parallax is so difficult to detect that its existence was the subject of much debate in astronomy for thousands of years. It was first observed by Giuseppe Calandrelli who reported parallax in α-Lyrae in his work “Osservazione e riflessione sulla parallasse annua dall’alfa della Lira”. Then in 1838 Friedrich Bessel made the first successful parallax measurement ever, for the star 61 Cygni, using a Fraunhofer heliometer at Königsberg Observatory.

Once a star’s parallax is known, its distance from Earth can be computed trigonometrically. But the more distant an object is, the smaller its parallax. Even with 21st-century techniques in astrometry, the limits of accurate measurement make distances farther away than about 100 parsecs (roughly 326 light years) too approximate to be useful when obtained by this technique. This limits the applicability of parallax as a measurement of distance to objects that are relatively close on a galactic scale. Other techniques, such as spectral red-shift, are required to measure the distance of more remote objects.
source


Halo (optical phenomenon)
Halo is the name for a family of optical phenomena produced by light interacting with ice crystals suspended in the atmosphere. Halos can have many forms, ranging from colored or white rings to arcs and spots in the sky. Many of these are near the Sun or Moon, but others occur elsewhere or even in the opposite part of the sky. Among the best known halo types are the circular halo (properly called the 22° halo), light pillars and sun dogs, but there are many more; some of them fairly common, others (extremely) rare.
The ice crystals responsible for halos are typically suspended in cirrus or cirrostratus clouds high (5–10 km, or 3–6 miles) in the upper troposphere, but in cold weather they can also float near the ground, in which case they are referred to as diamond dust. The particular shape and orientation of the crystals are responsible for the type of halo observed. Light is reflected and refracted by the ice crystals and may split up into colors because of dispersion. The crystals behave like prisms and mirrors, refracting and reflecting light between their faces, sending shafts of light in particular directions.
source
images: x, x, x, x, x, x, x, x, x, x

Gardner Megadome (também conhecido como Vitruvius T1):
Grande escudo vulcânico.
Diâmetro: 70 Km;
Altitude máxima: 1,6 Km;
Coordenadas Selenográficas: LAT: 16º 44’ 00’ N, LON: 33º 56’ 00” E;
Período Geológico Lunar: Não determinado.
Melhor período para observação: cinco dias após a Lua nova ou quatro dias após a Lua cheia. Quem foi GARDNER? Dr. Irvine Clifton Gardner (1889-1972) foi um físico americano que em 1921 se juntou ao National Bureau of Standards e em 1950 tornou-se chefe da Divisão de Óptica e Meteorologia. Ele foi presidente da Optical Society of America em 1958. Ficou conhecido por seu trabalho em óptica e no campo da espectroscopia.
Gardner Megadome foi, provavelmente, um imenso vulcão lunar, com 70 Km de diâmetro e 1,6 Km de altitude máxima, caracterizado como um grande escudo vulcânico, de textura áspera, formado possivelmente por um complexo coeso de domos sobrepostos e cobertos por lava, apresentando muitos impactos de minúsculas crateras em sua superfície.
Gardner Megadome é uma formação incomum, que consiste numa enorme área elevada localizada logo ao sul da cratera GARDNER (diâmetro: 18 Km, profundidade: 3,0 Km), com uma grande depressão no topo com indícios e possibilidades de ser uma caldeira vulcânica, conhecida como cratera Vitruvius H (diâmetro: 22 Km, profundidade: 400 m).
A cratera VITRUVIUS (diâmetro:29 Km, profundidade: 1,9 Km) localiza-se logo a noroeste do interessante Gardner Megadome.
Foto executada por Vaz Tolentino com apenas 1 frame em 10 de abril de 2012, 04:07:54 (07:07:54 UT).
ffffffffB$��Y]
What’s Up - February 2018
What’s Up For February?

This month, in honor of Valentine’s Day, we’ll focus on celestial star pairs and constellation couples.

Let’s look at some celestial pairs!

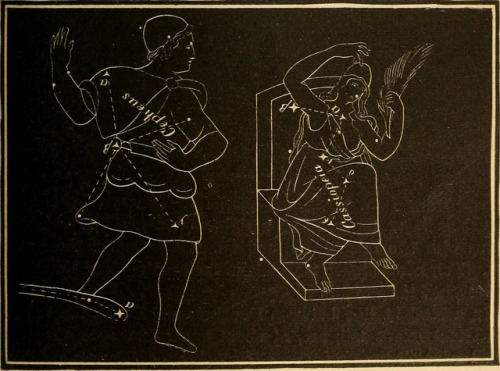
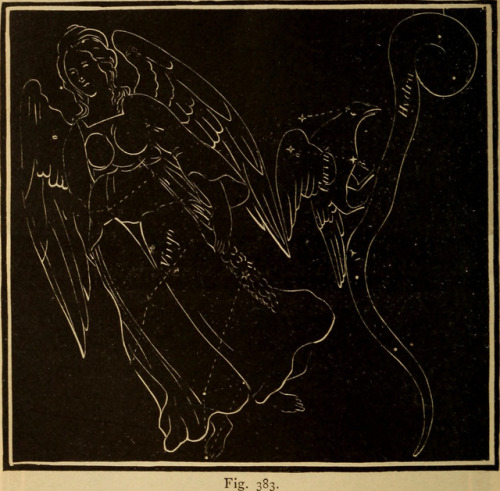
The constellations Perseus and Andromeda are easy to see high overhead this month.

According to lore, the warrior Perseus spotted a beautiful woman–Andromeda–chained to a seaside rock. After battling a sea serpent, he rescued her.

As a reward, her parents Cepheus and Cassiopeia allowed Perseus to marry Andromeda.

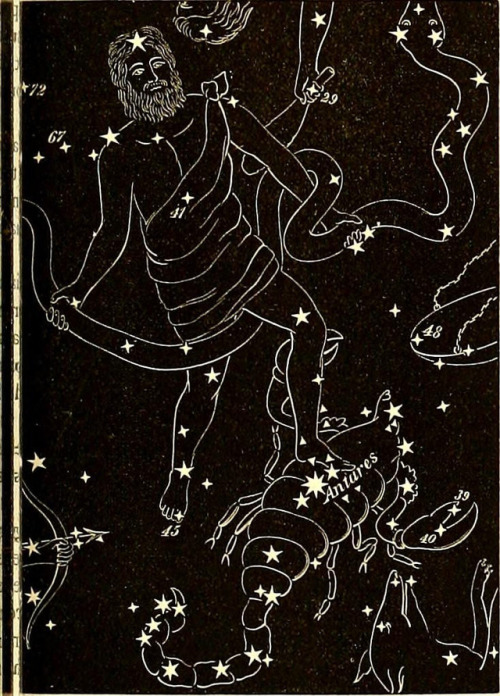
The great hunter Orion fell in love with seven sisters, the Pleiades, and pursued them for a long time. Eventually Zeus turned both Orion and the Pleiades into stars.

Orion is easy to find. Draw an imaginary line through his belt stars to the Pleiades, and watch him chase them across the sky forever.

A pair of star clusters is visible on February nights. The Perseus Double Cluster is high in the sky near Andromeda’s parents Cepheus and Cassiopeia.

Through binoculars you can see dozens of stars in each cluster. Actually, there are more than 300 blue-white supergiant stars in each of the clusters.

There are some colorful star pairs, some visible just by looking up and some requiring a telescope. Gemini’s twins, the brothers Pollux and Castor, are easy to see without aid.

Orion’s westernmost, or right, knee, Rigel, has a faint companion. The companion, Rigel B, is 500 times fainter than the super-giant Rigel and is visible only with a telescope.

Orion’s westernmost belt star, Mintaka, has a pretty companion. You’ll need a telescope.

Finally, the moon pairs up with the Pleiades on the 22nd and with Pollux and Castor on the 26th.
Watch the full What’s Up for February Video:
There are so many sights to see in the sky. To stay informed, subscribe to our What’s Up video series on Facebook.
Make sure to follow us on Tumblr for your regular dose of space: http://nasa.tumblr.com.
Infrared is Beautiful
Why was James Webb Space Telescope designed to observe infrared light? How can its images hope to compare to those taken by the (primarily) visible-light Hubble Space Telescope? The short answer is that Webb will absolutely capture beautiful images of the universe, even if it won’t see exactly what Hubble sees. (Spoiler: It will see a lot of things even better.)

The James Webb Space Telescope, or Webb, is our upcoming infrared space observatory, which will launch in 2019. It will spy the first luminous objects that formed in the universe and shed light on how galaxies evolve, how stars and planetary systems are born, and how life could form on other planets.
What is infrared light?
This may surprise you, but your remote control uses light waves just beyond the visible spectrum of light—infrared light waves—to change channels on your TV.
Infrared light shows us how hot things are. It can also show us how cold things are. But it all has to do with heat. Since the primary source of infrared radiation is heat or thermal radiation, any object that has a temperature radiates in the infrared. Even objects that we think of as being very cold, such as an ice cube, emit infrared.
There are legitimate scientific reasons for Webb to be an infrared telescope. There are things we want to know more about, and we need an infrared telescope to learn about them. Things like: stars and planets being born inside clouds of dust and gas; the very first stars and galaxies, which are so far away the light they emit has been stretched into the infrared; and the chemical fingerprints of elements and molecules in the atmospheres of exoplanets, some of which are only seen in the infrared.
In a star-forming region of space called the ‘Pillars of Creation,’ this is what we see with visible light:

And this is what we see with infrared light:

Infrared light can pierce through obscuring dust and gas and unveil a more unfamiliar view.
Webb will see some visible light: red and orange. But the truth is that even though Webb sees mostly infrared light, it will still take beautiful images. The beauty and quality of an astronomical image depends on two things: the sharpness of the image and the number of pixels in the camera. On both of these counts, Webb is very similar to, and in many ways better than, Hubble. Webb will take much sharper images than Hubble at infrared wavelengths, and Hubble has comparable resolution at the visible wavelengths that Webb can see.

Webb’s infrared data can be translated by computer into something our eyes can appreciate – in fact, this is what we do with Hubble data. The gorgeous images we see from Hubble don’t pop out of the telescope looking fully formed. To maximize the resolution of the images, Hubble takes multiple exposures through different color filters on its cameras.
The separate exposures, which look black and white, are assembled into a true color picture via image processing. Full color is important to image analysis of celestial objects. It can be used to highlight the glow of various elements in a nebula, or different stellar populations in a galaxy. It can also highlight interesting features of the object that might be overlooked in a black and white exposure, and so the images not only look beautiful but also contain a lot of useful scientific information about the structure, temperatures, and chemical makeup of a celestial object.
This image shows the sequences in the production of a Hubble image of nebula Messier 17:

Here’s another compelling argument for having telescopes that view the universe outside the spectrum of visible light – not everything in the universe emits visible light. There are many phenomena which can only be seen at certain wavelengths of light, for example, in the X-ray part of the spectrum, or in the ultraviolet. When we combine images taken at different wavelengths of light, we can get a better understanding of an object, because each wavelength can show us a different feature or facet of it.
Just like infrared data can be made into something meaningful to human eyes, so can each of the other wavelengths of light, even X-rays and gamma-rays.
Below is an image of the M82 galaxy created using X-ray data from the Chandra X-ray Observatory, infrared data from the Spitzer Space Telescope, and visible light data from Hubble. Also note how aesthetically pleasing the image is despite it not being just optical light:

Though Hubble sees primarily visible light, it can see some infrared. And despite not being optimized for it, and being much less powerful than Webb, it still produced this stunning image of the Horsehead Nebula.

It’s a big universe out there – more than our eyes can see. But with all the telescopes now at our disposal (as well as the new ones that will be coming online in the future), we are slowly building a more accurate picture. And it’s definitely a beautiful one. Just take a look…
…At this Spitzer infrared image of a shock wave in dust around the star Zeta Ophiuchi.

…this Spitzer image of the Helix Nebula, created using infrared data from the telescope and ultraviolet data from the Galaxy Evolution Explorer.

…this image of the “wing” of the Small Magellanic Cloud, created with infrared data from Spitzer and X-ray data from Chandra.

…the below image of the Milky Way’s galactic center, taken with our flying SOFIA telescope. It flies at more than 40,000 feet, putting it above 99% of the water vapor in Earth’s atmosphere– critical for observing infrared because water vapor blocks infrared light from reaching the ground. This infrared view reveals the ring of gas and dust around a supermassive black hole that can’t be seen with visible light.

…and this Hubble image of the Mystic Mountains in the Carina Nebula.

Learn more about the James Webb Space Telescope HERE, or follow the mission on Facebook, Twitter and Instagram.
Image Credits Eagle Nebula: NASA, ESA/Hubble and the Hubble Heritage Team Hubble Image Processing - Messier 17: NASA/STScI Galaxy M82 Composite Image: NASA, CXC, JHU, D.Strickland, JPL-Caltech, C. Engelbracht (University of Arizona), ESA, and The Hubble Heritage Team (STScI/AURA) Horsehead Nebula: NASA, ESA, and The Hubble Heritage Team (STScI/AURA) Zeta Ophiuchi: NASA/JPL-Caltech Helix Nebula: NASA/JPL-Caltech Wing of the Small Magellanic Cloud X-ray: NASA/CXC/Univ.Potsdam/L.Oskinova et al; Optical: NASA/STScI; Infrared: NASA/JPL-Caltech Milky Way Circumnuclear Ring: NASA/DLR/USRA/DSI/FORCAST Team/ Lau et al. 2013 Mystic Mountains in the Carina Nebula: NASA/ESA/M. Livio & Hubble 20th Anniversary Team (STScI)
Make sure to follow us on Tumblr for your regular dose of space: http://nasa.tumblr.com.
A Origem das FRBs - Fast Radio Bursts - Space Today TV Ep.1070
Talvez um dos maiores mistérios da astronomia possa estar perto de ser solucionado.
Quem lembra do meu vídeo de retrospectiva de 2017 deve lembrar que eu falei que o ano de 2017 foi um ano interessante para um fenômeno conhecido como FRBs, ou Fast Radio Bursts.
Esses fenômenos são explosões rápidas que acontecem no comprimento de onda de ondas de rádio, são fenômenos raros de serem observados e muito intrigantes.
Chegou-se até a pensar que poderiam ser sinais emitidos por civilizações extra-terrestres.
Um desses fenômenos é especial, e é conhecido como FRB121102.
É um evento de FRB que se repete, mais de 200 explosões de alta energia foram registradas desse único evento.
Em 2017 os pesquisadores conseguiram publicar qual é a origem desse evento, uma região de formação de estrelas numa galáxia anã, localizada a cerca de 3 bilhões de anos-luz de distância da Terra.
Embora a localização tenha sido descoberta, o mistério ainda residia sobre a origem.
O que causa um evento desses?
Um grupo de pesquisadores resolveu então estudar os sinais recebidos desse evento de FRB e descobriram algo interessante, que essa explosão tinha uma propriedade conhecida como polarização.
E esse efeito de polarização permitiu que os astrônomos estudassem o ambiente da fonte que gerou essa FRB.
O ambiente da FRB 121102 possui um campo magnético intenso em um plasma de grande densidade.
Isso foi possível descobrir pois a polarização sofreu uma perturbação muito intensa, perturbação essa que é causada pela presença de um campo magnético muito forte.
Sabendo também que a duração das explosões dessa FRB varia de 30 microssegundos a 9 milissegundos, os astrônomos integraram essas informações e chegaram à seguinte conclusão.
A fonte é pequena, com cerca de 10 km de diâmetro, mas que é extremamente densa e que gera um campo magnético intenso.
Isso se encaixa muito bem em estrelas de nêutrons.
Ou uma magentar interagindo com a nebulosa de material expelido pela estrela original.
Ou até mesmo um pulsar.
O mecanismo exato não é conhecido ainda, mas uma coisa é certa, o ambiente onde a FRB foi gerada é único e pode indicar um novo tipo de objeto ou uma nova interação entre dois objetos densos e altamente magnetizados.
Assim, um dos grandes mistérios da astronomia está aos poucos sendo completamente entendido o que é muito importante para entendermos o funcionamento do universo.
Solar System: 10 Things to Know This Week
January 8: Images for Your Computer or Phone Wallpaper
Need some fresh perspective? Here are 10 vision-stretching images for your computer desktop or phone wallpaper. These are all real pictures, sent recently by our planetary missions throughout the solar system. You’ll find more of our images at solarsystem.nasa.gov/galleries, images.nasa.gov and www.jpl.nasa.gov/spaceimages.
Applying Wallpaper: 1. Click on the screen resolution you would like to use. 2. Right-click on the image (control-click on a Mac) and select the option ‘Set the Background’ or 'Set as Wallpaper’ (or similar).
1. The Fault in Our Mars

This image from our Mars Reconnaissance Orbiter (MRO) of northern Meridiani Planum shows faults that have disrupted layered deposits. Some of the faults produced a clean break along the layers, displacing and offsetting individual beds.
Desktop: 1280 x 800 | 1600 x 1200 | 1920 x 1200 Mobile: 1440 x 2560 | 1080 x 1920 | 750 x 1334
2. Jupiter Blues

Our Juno spacecraft captured this image when the spacecraft was only 11,747 miles (18,906 kilometers) from the tops of Jupiter’s clouds – that’s roughly as far as the distance between New York City and Perth, Australia. The color-enhanced image, which captures a cloud system in Jupiter’s northern hemisphere, was taken on Oct. 24, 2017, when Juno was at a latitude of 57.57 degrees (nearly three-fifths of the way from Jupiter’s equator to its north pole) and performing its ninth close flyby of the gas giant planet.
Desktop: 1280 x 800 | 1600 x 1200 | 1920 x 1200 Mobile: 1440 x 2560 | 1080 x 1920 | 750 x 1334
3. A Farewell to Saturn

After more than 13 years at Saturn, and with its fate sealed, our Cassini spacecraft bid farewell to the Saturnian system by firing the shutters of its wide-angle camera and capturing this last, full mosaic of Saturn and its rings two days before the spacecraft’s dramatic plunge into the planet’s atmosphere on Sept. 15, 2017.
Desktop: 1280 x 800 | 1600 x 1200 | 1920 x 1200 Mobile: 1440 x 2560 | 1080 x 1920 | 750 x 1334
4. All Aglow

Saturn’s moon Enceladus drifts before the rings, which glow brightly in the sunlight. Beneath its icy exterior shell, Enceladus hides a global ocean of liquid water. Just visible at the moon’s south pole (at bottom here) is the plume of water ice particles and other material that constantly spews from that ocean via fractures in the ice. The bright speck to the right of Enceladus is a distant star. This image was taken in visible light with the Cassini spacecraft narrow-angle camera on Nov. 6, 2011.
Desktop: 1280 x 800 | 1600 x 1200 | 1920 x 1200 Mobile: 1440 x 2560 | 1080 x 1920 | 750 x 1334
5. Rare Encircling Filament

Our Solar Dynamics Observatory came across an oddity this week that the spacecraft has rarely observed before: a dark filament encircling an active region (Oct. 29-31, 2017). Solar filaments are clouds of charged particles that float above the Sun, tethered to it by magnetic forces. They are usually elongated and uneven strands. Only a handful of times before have we seen one shaped like a circle. (The black area to the left of the brighter active region is a coronal hole, a magnetically open region of the Sun).
Desktop: 1280 x 800 | 1600 x 1200 | 1920 x 1200 Mobile: 1440 x 2560 | 1080 x 1920 | 750 x 1334
6. Jupiter’s Stunning Southern Hemisphere

See Jupiter’s southern hemisphere in beautiful detail in this image taken by our Juno spacecraft. The color-enhanced view captures one of the white ovals in the “String of Pearls,” one of eight massive rotating storms at 40 degrees south latitude on the gas giant planet. The image was taken on Oct. 24, 2017, as Juno performed its ninth close flyby of Jupiter. At the time the image was taken, the spacecraft was 20,577 miles (33,115 kilometers) from the tops of the clouds of the planet.
Desktop: 1280 x 800 | 1600 x 1200 | 1920 x 1200 Mobile: 1440 x 2560 | 1080 x 1920 | 750 x 1334
7. Saturn’s Rings: View from Beneath

Our Cassini spacecraft obtained this panoramic view of Saturn’s rings on Sept. 9, 2017, just minutes after it passed through the ring plane. The view looks upward at the southern face of the rings from a vantage point above Saturn’s southern hemisphere.
Desktop: 1280 x 800 | 1600 x 1200 | 1920 x 1200 Mobile: 1440 x 2560 | 1080 x 1920 | 750 x 1334
8. From Hot to Hottest

This sequence of images from our Solar Dynamics Observatory shows the Sun from its surface to its upper atmosphere all taken at about the same time (Oct. 27, 2017). The first shows the surface of the sun in filtered white light; the other seven images were taken in different wavelengths of extreme ultraviolet light. Note that each wavelength reveals somewhat different features. They are shown in order of temperature, from the first one at about 11,000 degrees Fahrenheit (6,000 degrees Celsius) on the surface, out to about 10 million degrees in the upper atmosphere. Yes, the sun’s outer atmosphere is much, much hotter than the surface. Scientists are getting closer to solving the processes that generate this phenomenon.
Desktop: 1280 x 800 | 1600 x 1200 | 1920 x 1200 Mobile: 1440 x 2560 | 1080 x 1920 | 750 x 1334
9. High Resolution View of Ceres

This orthographic projection shows dwarf planet Ceres as seen by our Dawn spacecraft. The projection is centered on Occator Crater, home to the brightest area on Ceres. Occator is centered at 20 degrees north latitude, 239 degrees east longitude.
Desktop: 1280 x 800 | 1600 x 1200 | 1920 x 1200 Mobile: 1440 x 2560 | 1080 x 1920 | 750 x 1334
10. In the Chasm

This image from our Mars Reconnaissance Orbiter shows a small portion of the floor of Coprates Chasma, a large trough within the Valles Marineris system of canyons. Although the exact sequence of events that formed Coprates Chasma is unknown, the ripples, mesas, and craters visible throughout the terrain point to a complex history involving multiple mechanisms of erosion and deposition. The main trough of Coprates Chasma ranges from 37 miles (60 kilometers) to 62 miles (100 kilometers) in width.
Desktop: 1280 x 800 | 1600 x 1200 | 1920 x 1200 Mobile: 1440 x 2560 | 1080 x 1920 | 750 x 1334
Explore and learn more about our solar system at: solarsystem.nasa.gov/.
Make sure to follow us on Tumblr for your regular dose of space: http://nasa.tumblr.com.
Detectando Ondas Gravitacionais Com a Missão GAIA - Space Today TV Ep.1057
As ondas gravitacionais, para quem ainda não sabe, tem um espectro, assim como a radiação eletromagnética tem o seu.
Esse espectro é chamado de espectro gravitacional.
Dentro do espectro gravitacional, atualmente, com o LIGO e VIRGO nós só conseguimos detectar ondas gravitacionais provenientes da fusão de buracos negros de massa estelar e da fusão de estrelas de nêutrons.
Essas, digamos, são ondas gravitacionais com frequências mais altas.
Mas lógico que existe a ideia e a vontade de se detectar ondas gravitacionais de frequências baixas.
Essas são produzidas, por exemplo, pela colisão de buracos negros supermassivos.
Nós já avançamos um pouco nesse sentido, já que a tecnologia da LISA, um detector espacial nos moldes do LIGO já foi testada e promete funcionar.
Existe também, como já falei aqui a técnica de usar os pulsares, a chamada Pulsar Timing Array.
Essa técnica é interessante, pois ela usa a observação dos pulsares, e calcula a mudança na frequência aparente dos pulsos com relação à passagem de uma onda gravitacional, gerada pela fusão de buracos negros supermassivos, por exemplo.
com base nessa ideia, um grupo de astrofísicos está propondo algo maravilhoso.
Eles querem usar a missão GAIA, da Agência Espacial Europeia, que mede com precisão a posição de bilhões de estrelas na Via Láctea como um detector de ondas gravitacionais de baixa frequência.
Para isso, a ideia é usar não a variação de pulsos dos pulsares, mas sim a aparente modificação na posição das estrelas observadas pela GAIA, ou seja, suas oscilações para detectar as ondas gravitacionais.
A passagem de uma onda gravitacional, que acaba causando uma oscilação no tecido do espaço-tempo, muda a posição das estrelas, a polarização da onda gravitacional pode ser detectada e assim teríamos a detecção de um tipo novo de onda gravitacional.
A vantagem é que a missão GAIA já está em funcionamento no espaço, já faz essas medidas, ou seja, essa aplicação pode ser testada a qualquer momento.
Os astrônomos realmente viram que o estudo das ondas gravitacionais pode trazer muitos novos conhecimentos sobre o universo, e entender os buracos negros supermassivos é algo que os deixa muito animados.
Vamos aguardar por novidades nessa área.
What’s Up - January 2018
What’s Up For January?
Quadrantid meteors, a West Coast-favoring total lunar eclipse and time to start watching Mars!

This month the new year’s first meteor shower fizzles, Mars meets Jupiter in the morning sky and the U.S. will enjoy a total lunar eclipse!

Most meteor showers radiate from recognizable constellations. Like the Leonids, Geminids and Orionids.

But the Quadrantids are meteors that appear to radiate from the location of the former Quadrans Muralis constellation, an area that’s now part of the constellation Bootes.

The Quadrantids’ peak lasts for just a few hours, and sadly, this year their timing coincides with a very bright, nearly full moon that will wash out most of the meteors.

You can look in any direction to see all the meteor showers. When you see one of these meteors, hold a shoestring along the path it followed. The shoestring will lead you back to the constellation containing the meteor’s origin.

On the morning of January 6th, look in the south-southeast sky 45 minutes before sunrise to see Jupiter and fainter Mars almost as close as last month’s Jupiter and Venus close pairing.

Mars is only one-sixth the apparent diameter of Jupiter, but the two offer a great binocular and telescopic view with a pretty color contrast. They remain in each other’s neighborhood from January 5th through the 8th.

Finally, to end the month, a great total lunar eclipse favors the western U.S., Alaska, and Hawaii and British Columbia on January 31st. Australia and the Pacific Ocean are well placed to see a major portion of the eclipse–if not all of it.

Watch the full What’s Up for January Video:
There are so many sights to see in the sky. To stay informed, subscribe to our What’s Up video series on Facebook. Make sure to follow us on Tumblr for your regular dose of space: http://nasa.tumblr.com.
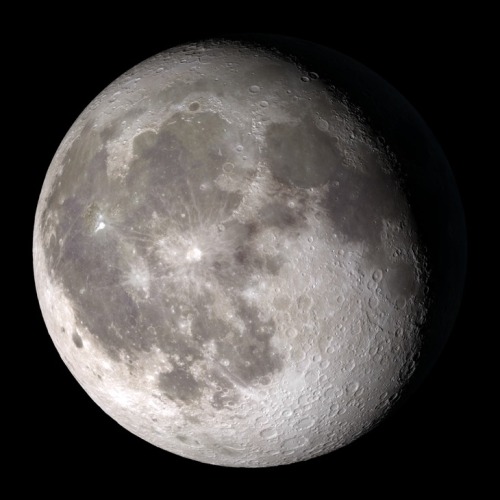
The Moon in Motion
Happy New Year! And happy supermoon! Tonight, the Moon will appear extra big and bright to welcome us into 2018 – about 6% bigger and 14% brighter than the average full Moon. And how do we know that? Well, each fall, our science visualizer Ernie Wright uses data from the Lunar Reconnaissance Orbiter (LRO) to render over a quarter of a million images of the Moon. He combines these images into an interactive visualization, Moon Phase and Libration, which depicts the Moon at every day and hour for the coming year.
Want to see what the Moon will look like on your birthday this year? Just put in the date, and even the hour (in Universal Time) you were born to see your birthday Moon.
Our Moon is quite dynamic. In addition to Moon phases, our Moon appears to get bigger and smaller throughout the year, and it wobbles! Or at least it looks that way to us on Earth. This wobbling is called libration, from the Latin for ‘balance scale’ (libra). Wright relies on LRO maps of the Moon and NASA orbit calculations to create the most accurate depiction of the 6 ways our Moon moves from our perspective.
1. Phases

The Moon phases we see on Earth are caused by the changing positions of the Earth and Moon relative to the Sun. The Sun always illuminates half of the Moon, but we see changing shapes as the Moon revolves around the Earth. Wright uses a software library called SPICE to calculate the position and orientation of the Moon and Earth at every moment of the year. With his visualization, you can input any day and time of the year and see what the Moon will look like!
2. Shape of the Moon

Check out that crater detail! The Moon is not a smooth sphere. It’s covered in mountains and valleys and thanks to LRO, we know the shape of the Moon better than any other celestial body in the universe. To get the most accurate depiction possible of where the sunlight falls on the lunar surface throughout the month, Wright uses the same graphics software used by Hollywood design studios, including Pixar, and a method called ‘raytracing’ to calculate the intricate patterns of light and shadow on the Moon’s surface, and he checks the accuracy of his renders against photographs of the Moon he takes through his own telescope.

3. Apparent Size

The Moon Phase and Libration visualization shows you the apparent size of the Moon. The Moon’s orbit is elliptical, instead of circular - so sometimes it is closer to the Earth and sometimes it is farther. You’ve probably heard the term “supermoon.” This describes a full Moon at or near perigee (the point when the Moon is closest to the Earth in its orbit). A supermoon can appear up to 14% bigger and brighter than a full Moon at apogee (the point when the Moon is farthest from the Earth in its orbit).
Our supermoon tonight is a full Moon very close to perigee, and will appear to be about 14% bigger than the July 27 full Moon, the smallest full Moon of 2018, occurring at apogee. Input those dates into the Moon Phase and Libration visualization to see this difference in apparent size!
4. East-West Libration
Over a month, the Moon appears to nod, twist, and roll. The east-west motion, called ‘libration in longitude’, is another effect of the Moon’s elliptical orbital path. As the Moon travels around the Earth, it goes faster or slower, depending on how close it is to the Earth. When the Moon gets close to the Earth, it speeds up thanks to an additional pull from Earth’s gravity. Then it slows down, when it’s farther from the Earth. While this speed in orbital motion changes, the rotational speed of the Moon stays constant.
This means that when the Moon moves faster around the Earth, the Moon itself doesn’t rotate quite enough to keep the same exact side facing us and we get to see a little more of the eastern side of the Moon. When the Moon moves more slowly around the Earth, its rotation gets a little ahead, and we see a bit more of its western side.
5. North-South Libration

The Moon also appears to nod, as if it were saying “yes,” a motion called ‘libration in latitude’. This is caused by the 5 degree tilt of the Moon’s orbit around the Earth. Sometimes the Moon is above the Earth’s northern hemisphere and sometimes it’s below the Earth’s southern hemisphere, and this lets us occasionally see slightly more of the northern or southern hemispheres of the Moon!
6. Axis Angle

Finally, the Moon appears to tilt back and forth like a metronome. The tilt of the Moon’s orbit contributes to this, but it’s mostly because of the 23.5 degree tilt of our own observing platform, the Earth. Imagine standing sideways on a ramp. Look left, and the ramp slopes up. Look right and the ramp slopes down.
Now look in front of you. The horizon will look higher on the right, lower on the left (try this by tilting your head left). But if you turn around, the horizon appears to tilt the opposite way (tilt your head to the right). The tilted platform of the Earth works the same way as we watch the Moon. Every two weeks we have to look in the opposite direction to see the Moon, and the ground beneath our feet is then tilted the opposite way as well.
So put this all together, and you get this:
Beautiful isn’t it? See if you can notice these phenomena when you observe the Moon. And keep coming back all year to check on the Moon’s changing appearance and help plan your observing sessions.
Follow @NASAMoon on Twitter to keep up with the latest lunar updates.
Make sure to follow us on Tumblr for your regular dose of space: http://nasa.tumblr.com.

Essa imagem capturada pela Wide Field Camera 3, a WFC3 do Hubble, mostra a galáxia chamada UGC 6093. Como se pode ver facilmente, a UGC 6093 é conhecida como uma galáxia espiral barrada - ela tem belos braços que espiralam a partir de uma barra que corta o centro da galáxia. Ela é classificada como uma galáxia ativa, o que significa que ela abriga um núcleo ativo de galáxia, ou um AGN, uma região compacta no centro da galáxia onde o material está centro dragado em direção do buraco negro supermassivo central. À medida que esse buraco negro devora material, ele emite intensa radiação, fazendo com que a galáxia brilhe intensamente. Mas a UGC 6093 é mais exótica ainda. A galáxia age essencialmente como um gigantesco laser astronômico que espalha sua luz nas microondas, não na luz visível, esse tipo de objeto é chamada de megamaser, sendo maser o termo usado para um laser de microondas. Os megamasers como a UGC 6093, podem ser cerca de 100 milhões de vezes mais brilhantes do que os masers encontrados em galáxias como a Via Láctea. A WFC3 do Hubble, observa a luz sendo espalhada em uma grande variedade de comprimentos de ondas, desde o infravermelho próximo, passando pela parte visível, até o ultravioleta próximo. Ela tem dois canais que detectam e processam os tipos diferentes de luz, permitindo que os astrônomos estudem uma grande quantidade de fenômenos astrofísicos, por exemplo, o canal UV-visível pode estudar galáxias que estão passando pelo processo de formação de estrelas, enquanto que o canal do infravermelho próximo pode estudar a luz desviada para o vermelho de galáxias no universo distante. Essas imagens multi-espectrais feitas pelo Hubble são de suma importância para estudar as galáxias megamasers.

A fotografia desta semana mostra fitas de gás e poeira em torno do centro da galáxia espiral barrada NGC 1398. Esta galáxia situa-se na constelação da Fornalha, a aproximadamente 65 milhões de anos-luz de distância da Terra.
Em vez de começarem no meio da galáxia e espiralarem para o exterior, os braços em espiral da NGC 1398 têm origem numa barra direita, formada de estrelas, que corta a região central da galáxia. Uma grande parte das galáxias em espiral — cerca de dois terços — apresenta esta estrutura, no entanto ainda não é claro se e como é que estas barras afectam o comportamento e o desenvolvimento das suas galáxias.
Esta imagem foi criada a partir de dados obtidos pelo instrumento FORS2 (FOcal Reducer/low dispersion Spectrograph 2), montado no Very Large Telescope do ESO (VLT) no Observatório do Paranal, no Chile, e mostra a NGC 1398 em grande detalhe, dos escuros trilhos de poeira que sarapintam os braços em espiral às regiões de formação estelar em tons rosa que aparecem nas regiões mais externas.
A imagem foi criada no âmbito do programa Jóias Cósmicas do ESO, o qual visa obter imagens de objetos interessantes, intrigantes ou visualmente atrativos, utilizando os telescópios do ESO, para efeitos de educação e divulgação científica. O programa utiliza tempo de telescópio que não pode ser usado em observações científicas. Todos os dados obtidos podem ter igualmente interesse científico e são por isso postos à disposição dos astrónomos através do arquivo científico do ESO. Crédito da Imagem: ESO

O que está acontecendo com o Sol? Algumas vezes parece que estamos vendo o Sol através de uma lente gignatesca, contudo, na verdade, estamos vendo ele através de milhões de pequenas lentes, os cristais de gelo. A água pode se congelar na atmosfera formando pequenos, achatados cristais de gelo hexagonais. Quando esses cristais flutuam, a maior parte do tempo eles passam com suas faces achatadas e parelelas ao solo. Um observador pode se encontrar no mesmo plano dos cristais de gelo perto do nascer ou do pôr do Sol. Durante esse alinhamento, cada cristal pode agir como uma lente em miniatura, refratando a luz do Sol e criando um fenômeno chamado de parélio, ou sundog. O vídeo acima foi feito a um mês atrás numa região perto de Estocolmo, na Suécia que é uma estação de ski e é conhecida como Vamdalen Ski Resort. Bem no centro está o Sol, enquanto que os proeminentes sundogs brilham à esquerda e à direita dele. Também visível nesse vídeo está o halo de 22 graus, bem como o mais raro e mais apagado, halo de 46 graus, halos esses que também são criados pela reflexão do Sol nos cristais de gelo na atmosfera.
Fonte:
https://apod.nasa.gov/apod/ap180101.html
Are we alone in the universe?
There’s never been a better time to ponder this age-old question. We now know of thousands of exoplanets – planets that orbit stars elsewhere in the universe.

So just how many of these planets could support life?
Scientists from a variety of fields — including astrophysics, Earth science, heliophysics and planetary science — are working on this question. Here are a few of the strategies they’re using to learn more about the habitability of exoplanets.
Squinting at Earth
Even our best telescopic images of exoplanets are still only a few pixels in size. Just how much information can we extract from such limited data? That’s what Earth scientists have been trying to figure out.
One group of scientists has been taking high-resolution images of Earth from our Earth Polychromatic Imaging Camera and ‘degrading’ them in order to match the resolution of our pixelated exoplanet images. From there, they set about a grand process of reverse-engineering: They try to extract as much accurate information as they can from what seems — at first glance — to be a fairly uninformative image.

Credits: NOAA/NASA/DSCOVR
So far, by looking at how Earth’s brightness changes when land versus water is in view, scientists have been able to reverse-engineer Earth’s albedo (the proportion of solar radiation it reflects), its obliquity (the tilt of its axis relative to its orbital plane), its rate of rotation, and even differences between the seasons. All of these factors could potentially influence a planet’s ability to support life.
Avoiding the “Venus Zone”
In life as in science, even bad examples can be instructive. When it comes to habitability, Venus is a bad example indeed: With an average surface temperature of 850 degrees Fahrenheit, an atmosphere filled with sulfuric acid, and surface pressure 90 times stronger than Earth’s, Venus is far from friendly to life as we know it.

The surface of Venus, imaged by Soviet spacecraft Venera 13 in March 1982
Since Earth and Venus are so close in size and yet so different in habitability, scientists are studying the signatures that distinguish Earth from Venus as a tool for differentiating habitable planets from their unfriendly look-alikes.
Using data from our Kepler Space Telescope, scientists are working to define the “Venus Zone,” an area where planetary insolation – the amount of light a given planet receives from its host star – plays a key role in atmospheric erosion and greenhouse gas cycles.

Planets that appear similar to Earth, but are in the Venus Zone of their star, are, we think, unlikely to be able to support life.
Modeling Star-Planet Interactions
When you don’t know one variable in an equation, it can help to plug in a reasonable guess and see how things work out. Scientists used this process to study Proxima b, our closest exoplanet neighbor. We don’t yet know whether Proxima b, which orbits the red dwarf star Proxima Centauri four light-years away, has an atmosphere or a magnetic field like Earth’s. However, we can estimate what would happen if it did.
The scientists started by calculating the radiation emitted by Proxima Centauri based on observations from our Chandra X-ray Observatory. Given that amount of radiation, they estimated how much atmosphere Proxima b would be likely to lose due to ionospheric escape — a process in which the constant outpouring of charged stellar material strips away atmospheric gases.

With the extreme conditions likely to exist at Proxima b, the planet could lose the equivalent of Earth’s entire atmosphere in 100 million years — just a fraction of Proxima b’s 4-billion-year lifetime. Even in the best-case scenario, that much atmospheric mass escapes over 2 billion years. In other words, even if Proxima b did at one point have an atmosphere like Earth, it would likely be long gone by now.
Imagining Mars with a Different Star
We think Mars was once habitable, supporting water and an atmosphere like Earth’s. But over time, it gradually lost its atmosphere – in part because Mars, unlike Earth, doesn’t have a protective magnetic field, so Mars is exposed to much harsher radiation from the Sun’s solar wind.

But as another rocky planet at the edge of our solar system’s habitable zone, Mars provides a useful model for a potentially habitable planet. Data from our Mars Atmosphere and Volatile Evolution, or MAVEN, mission is helping scientists answer the question: How would Mars have evolved if it were orbiting a different kind of star?
Scientists used computer simulations with data from MAVEN to model a Mars-like planet orbiting a hypothetical M-type red dwarf star. The habitable zone of such a star is much closer than the one around our Sun.

Being in the habitable zone that much closer to a star has repercussions. In this imaginary situation, the planet would receive about 5 to 10 times more ultraviolet radiation than the real Mars does, speeding up atmospheric escape to much higher rates and shortening the habitable period for the planet by a factor of about 5 to 20.
These results make clear just how delicate a balance needs to exist for life to flourish. But each of these methods provides a valuable new tool in the multi-faceted search for exoplanet life. Armed with these tools, and bringing to bear a diversity of scientific perspectives, we are better positioned than ever to ask: are we alone?
Make sure to follow us on Tumblr for your regular dose of space: http://nasa.tumblr.com.
Our Most “Liked” Instagram Posts of 2017
Our Instagram page has over 2,200 images and is lucky enough to be followed by more than 29 million fans.
What images and videos were your favorite from this past year? Great question, and one we asked ourselves too!
Here’s a look at our most liked Instagram posts* of 2017…Enjoy!
#10 Black Hole Collision

What happens when two supermassive black holes collide? Until last year, we weren’t quite sure. Gravitational waves! With 834,169 likes, this image is our 10th most liked of 2017.
#9 Italy Through the Space Station Cupola Window

European astronaut Paolo Nespoli (@Astro_Paolo) shared this image on social media of “Southern #Italy and Sicily framed by one of our Cupola windows” aboard the International Space Station. This image ranks #9 for 2017 with 847,365 likes.
#8 Black Hole Friday

For our 5th annual #BlackHoleFriday we’ll share awesome images and facts about black holes! A black hole is a place in space where gravity pulls so much that even light cannot get out. With 916,247 likes, this picture ranks #8 for 2017.
#7 The Elements of Cassiopeia A

Did you know that stellar explosions and their remains–“supernova remnants”–are a source of chemical elements essential for life here on Earth? A new Chandra X-ray Observatory image captures the location of several vital elements like silicon (red), sulfur (yellow), calcium (green) and iron (purple), located on Cassiopeia A–a supernova remnant ~11,000 light years from Earth. This image ranks #7 for 2017 with 943,806 likes.
#6 Jupiter Blues

Jupiter, you’re bluetiful 💙 ! Churning swirls of Jupiter’s clouds are seen in striking shades of blue in this new view taken by our Juno spacecraft. This image ranks as our sixth most liked Instagram post of 2017 with 990,944 likes.
#5 An Interstellar Visitor

An interstellar visitor…scientists have confirmed that an intriguing asteroid that zipped through our solar system in October is the first confirmed object from another star! Observations suggest that this unusual object had been wandering through the Milky Way, unattached to any star system, for hundreds of millions of years before its chance encounter with our star system. With 1,015,721 likes, this image ranks #5 for 2017.
#4 Space Station Lunar Transit

Space station supermoon. This composite image made from six frames shows the International Space Station, with a crew of six onboard, as it transits the Moon at roughly five miles per second on Dec. 2. This image ranks #4 for 2017 with 1,037,520 likes.
#3 The Space Between Us
A post shared by NASA (@nasa) on Dec 20, 2017 at 2:56pm PST
The beautiful space between Earth and the International Space Station was immortalized by NASA astronaut Mark Vande Hei while orbiting 250 miles above the planet we call home. This majestic image ranks #3 for 2017 with 1,042,403 likes.
#2 The Moon Swallows the Sun
A post shared by NASA (@nasa) on Aug 21, 2017 at 2:03pm PDT
Today, the Sun disappeared, seemingly swallowed by our Moon–at least for a while. The August 21 solar eclipse cut through a swath of North America from coast to coast and those along the path of totality, that is where the Moon completely covered the Sun, were faced with a sight unseen in the U.S. in 99 years. Which might have something to do with this image ranking #2 for 2017 with 1,144,503 likes.
#1 Solar Eclipse Over Cascade Lake
A post shared by NASA (@nasa) on Aug 21, 2017 at 3:57pm PDT
Behold! This progression of the partial solar eclipse took place over Ross Lake, in Northern Cascades National Park, Washington on Monday, Aug. 21, 2017.
This photo was our #1 image of 2017 with 1,471,114 likes!
See them all here!
Do you want to get amazing images of Earth from space, see distant galaxies and more on Instagram? Of course you do! Follow us: https://www.instagram.com/nasa/
*Posts and rankings are were taken as of Dec. 28, 2017.
Make sure to follow us on Tumblr for your regular dose of space: http://nasa.tumblr.com.
Reinventing the Wheel
Planning a trip to the Moon? Mars? You’re going to need good tires…

Exploration requires mobility. And whether you’re on Earth or as far away as the Moon or Mars, you need good tires to get your vehicle from one place to another. Our decades-long work developing tires for space exploration has led to new game-changing designs and materials. Yes, we’re reinventing the wheel—here’s why.
Wheels on the Moon

Early tire designs were focused on moving hardware and astronauts across the lunar surface. The last NASA vehicle to visit the Moon was the Lunar Roving Vehicle during our Apollo missions. The vehicle used four large flexible wire mesh wheels with stiff inner frames. We used these Apollo era tires as the inspiration for new designs using newer materials and technology to better function on a lunar surface.
Up springs a new idea

During the mid-2000s, we worked with industry partner Goodyear to develop the Spring Tire, an airless compliant tire that consists of several hundred coiled steel wires woven into a flexible mesh, giving the tires the ability to support high loads while also conforming to the terrain. The Spring Tire has been proven to generate very good traction and durability in soft sand and on rocks.
Spring Tires for Mars

A little over a year after the Mars Curiosity Rover landed on Mars, engineers began to notice significant wheel damage in 2013 due to the unexpectedly harsh terrain. That’s when engineers began developing new Spring Tire prototypes to determine if they would be a new and better solution for exploration rovers on Mars.

In order for Spring Tires to go the distance on Martian terrain, new materials were required. Enter nickel titanium, a shape memory alloy with amazing capabilities that allow the tire to deform down to the axle and return to its original shape.
These tires can take a lickin’

After building the shape memory alloy tire, Glenn engineers sent it to the Jet Propulsion Laboratory’s Mars Life Test Facility. It performed impressively on the punishing track.
Why reinvent the wheel? It’s worth it.

New, high performing tires would allow lunar and Mars rovers to explore greater regions of the surface than currently possible. They conform to the terrain and do not sink as much as rigid wheels, allowing them to carry heavier payloads for the same given mass and volume. Also, because they absorb energy from impacts at moderate to high speeds, there is potential for use on crewed exploration vehicles which are expected to move at speeds significantly higher than the current Mars rovers.
Airless tires on Earth

Maybe. Recently, engineers and materials scientists have been testing a spinoff tire version that would work on cars and trucks on Earth. Stay tuned as we continue to push the boundaries on traditional concepts for exploring our world and beyond.
Make sure to follow us on Tumblr for your regular dose of space: http://nasa.tumblr.com.
O que vamos ter em dezembro de 2017!
What's Up - December 2017
What’s Up For December? Geminid and Ursid meteor showers & winter constellations!

This month hosts the best meteor shower of the year and the brightest stars in familiar constellations.

The Geminds peak on the morning of the 14th, and are active from December 4th through the 17th. The peak lasts for a full 24 hours, meaning more worldwide meteor watchers will get to see this spectacle.

Expect to see up to 120 meteors per hour between midnight and 4 a.m. but only from a dark sky. You’ll see fewer after moonrise at 3:30 a.m. local time.

In the southern hemisphere, you won’t see as many, perhaps 10-20 per hour, because the radiant never rises above the horizon.

Take a moment to enjoy the circle of constellations and their brightest stars around Gemini this month.

Find yellow Capella in the constellation Auriga.

Next-going clockwise–at 1 o'clock find Taurus and bright reddish Aldebaran, plus the Pleiades.

At two, familiar Orion, with red Betelguese, blue-white Rigel, and the three famous belt stars in-between the two.

Next comes Leo, and its white lionhearted star, Regulus at 7 o'clock.

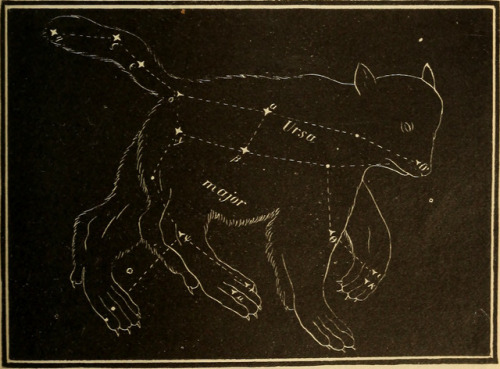
Another familiar constellation Ursa Major completes the view at 9 o'clock.

There’s a second meteor shower in December, the Ursids, radiating from Ursa Minor, the Little Dipper. If December 22nd and the morning of December 23rd are clear where you are, have a look at the Little Dipper’s bowl, and you might see about ten meteors per hour. Watch the full What’s Up for December Video:
There are so many sights to see in the sky. To stay informed, subscribe to our What’s Up video series on Facebook. Make sure to follow us on Tumblr for your regular dose of space: http://nasa.tumblr.com.

#Eclipse2017 . A mecânica do eclipse explicada numa figura do século 13.
Eclipse Across America
August 21, 2017, the United States experienced a solar eclipse!

An eclipse occurs when the Moon temporarily blocks the light from the Sun. Within the narrow, 60- to 70-mile-wide band stretching from Oregon to South Carolina called the path of totality, the Moon completely blocked out the Sun’s face; elsewhere in North America, the Moon covered only a part of the star, leaving a crescent-shaped Sun visible in the sky.

During this exciting event, we were collecting your images and reactions online.
Here are a few images of this celestial event…take a look:

This composite image, made from 4 frames, shows the International Space Station, with a crew of six onboard, as it transits the Sun at roughly five miles per second during a partial solar eclipse from, Northern Cascades National Park in Washington. Onboard as part of Expedition 52 are: NASA astronauts Peggy Whitson, Jack Fischer, and Randy Bresnik; Russian cosmonauts Fyodor Yurchikhin and Sergey Ryazanskiy; and ESA (European Space Agency) astronaut Paolo Nespoli.
Credit: NASA/Bill Ingalls

The Bailey’s Beads effect is seen as the moon makes its final move over the sun during the total solar eclipse on Monday, August 21, 2017 above Madras, Oregon.
Credit: NASA/Aubrey Gemignani

This image from one of our Twitter followers shows the eclipse through tree leaves as crescent shaped shadows from Seattle, WA.
Credit: Logan Johnson

“The eclipse in the palm of my hand”. The eclipse is seen here through an indirect method, known as a pinhole projector, by one of our followers on social media from Arlington, TX.
Credit: Mark Schnyder

Through the lens on a pair of solar filter glasses, a social media follower captures the partial eclipse from Norridgewock, ME.
Credit: Mikayla Chase

While most of us watched the eclipse from Earth, six humans had the opportunity to view the event from 250 miles above on the International Space Station. European Space Agency (ESA) astronaut Paolo Nespoli captured this image of the Moon’s shadow crossing America.
Credit: Paolo Nespoli

This composite image shows the progression of a partial solar eclipse over Ross Lake, in Northern Cascades National Park, Washington. The beautiful series of the partially eclipsed sun shows the full spectrum of the event.
Credit: NASA/Bill Ingalls
In this video captured at 1,500 frames per second with a high-speed camera, the International Space Station, with a crew of six onboard, is seen in silhouette as it transits the sun at roughly five miles per second during a partial solar eclipse, Monday, Aug. 21, 2017 near Banner, Wyoming.
Credit: NASA/Joel Kowsky
To see more images from our NASA photographers, visit: https://www.flickr.com/photos/nasahqphoto/albums/72157685363271303
Make sure to follow us on Tumblr for your regular dose of space: http://nasa.tumblr.com

Enquanto a Lua passava em frente do Sol durante o eclipse total do dia 21 de Agosto de 2017, um fotógrafo da NASA capturou uma foto que pode ser considerada mais rara do que o próprio eclipse.
Joel Kowsky, um dos editores de fotografia da agência, foi até Banner no Wyoming, para ver o eclipse total do Sol, quando ele fotografou a Estação Espacial Internacional passando na frente do Sol crescente.
Abaixo você pode ver um vídeo que foi feito usando uma câmera de alta velocidade que registrou 1500 frames por segundo. Ele também fotografou a ISS com uma câmera padrão.
Essa alta velocidade é necessária pois a ISS tem o tamanho de um campo de futebol, orbita a Terra a cerca de 300 km de altura e se move a uma velocidade 17500 milhas por hora.
Para fazer esse belo registro é necessário um pouco de sorte e meses e meses de planejamento.
ffff%v;��X

Imagem feita com 8 frames com High Dynamic Range destacando os detalhes da superfície da Lua durante a totalidade do #Eclipse2017 - by @johnkrausphotos
From the unique vantage point of about 25,000 feet above Earth, our Associate Administrator of Science at NASA, Dr. Thomas Zurbuchen, witnessed the 2017 eclipse. He posted this video to his social media accounts saying, “At the speed of darkness…watch as #SolarEclipse2017 shadow moves across our beautiful planet at <1 mile/second; as seen from GIII aircraft”.
Zurbuchen, along with NASA Acting Administrator Robert Lightfoot, Associate Administrator Lesa Roe traveled on a specially modified Gulfstream III aircraft flying north over the skies of Oregon.
In order to capture images of the event, the standard windows of the Gulfstream III were replaced with optical glass providing a clear view of the eclipse. This special glass limits glare and distortion of common acrylic aircraft windows. Heaters are aimed at the windows where the imagery equipment will be used to prevent icing that could obscure a clear view of the eclipse.
Learn more about the observations of the eclipse made from this aircraft HERE.
Make sure to follow us on Tumblr for your regular dose of space: http://nasa.tumblr.com